Practice With Real Market Data

The first stock I ever traded properly was a mid cap that moved about a dollar a day, and I lost money on it for a month before I worked out why. It was not the setup. The setup was fine. I was buying at the ask into a thin book and selling into whatever bid happened to be there, and the two or three cents I gave away each way was eating the whole edge. Nobody teaches that in a book. You learn it by putting orders into a real order book enough times that it stops surprising you.
A stock trading simulator is software that lets you buy and sell shares against real market data without risking money. The useful ones replay a historical session forward tick by tick, so you place orders into the same order book, the same spreads and the same volume that were there on the day. That matters more for equities than people expect, because a listed stock trades across a dozen venues at once, and the depth sitting behind the inside price is what decides whether your fill lands where you thought it would. A simulator that fills every order instantly at the last printed price is teaching you a market that does not exist. Practice on liquid names first, use share sizes you would actually trade, write down why you entered, and review the session afterwards. The point is not the profit on the practice account. It is the number of honest repetitions you bank before real money is involved.
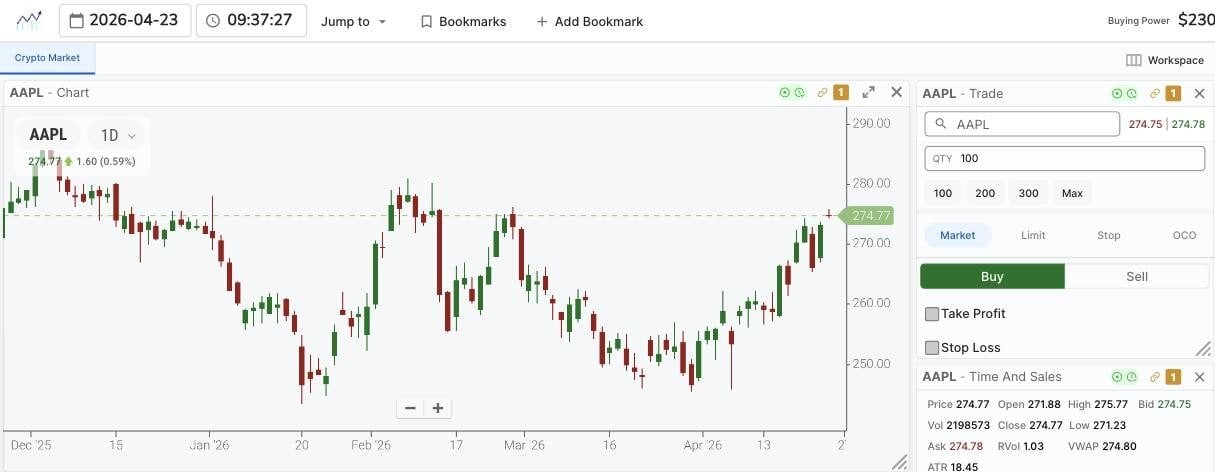
This guide covers what separates a stock simulator from a generic one, why the order book and the tape are the parts that matter for equities, how to structure a practice session, and where the new margin rules leave smaller accounts. Every screenshot below is from a live replay session I loaded while writing it, with the ticker, date and levels stated so you can check them.
What a Stock Trading Simulator Actually Does
Three jobs, and simulators are usually honest about one of them and vague about the other two.
It supplies data. It accepts orders. It keeps score. Where products diverge is how faithfully they do the middle one. A charting package with a fake buy button is not a simulator, it is a chart with a button. What you want is something that puts your order into a book with a bid and an ask and a queue, and then tells you what you actually got.
Our broader trading simulator guide covers the category as a whole. This page is about the equities-specific parts, because stocks have quirks that futures and index products do not.
Why Stocks Are Harder to Simulate Than They Look
A US listed stock does not trade in one place. It trades on the NYSE, on Nasdaq, on BATS, on EDGX, on the smaller venues, all at the same time, and the national best bid and offer is stitched together from all of them. When you hit a market order, you are not lifting one seller. You are lifting whoever is at the top of a fragmented book, and if the size there is small your order walks up through the next price levels.
This is the thing that makes equity practice different. On a liquid index future the book is deep and the spread is one tick almost all the time. On a stock the spread widens and narrows through the day, the depth thins out around the open and into the close, and a size that is nothing in one name will move another name several cents.
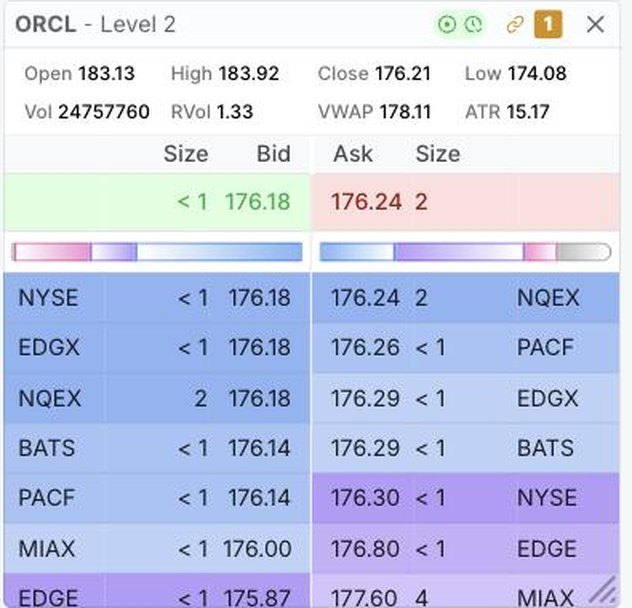
Look at the size column in that shot. Almost every level is showing under a hundred shares. If you sent a thousand share market order into that book you would not get 176.24. You would get some of it at 176.24, some at 176.26, some at 176.29, and your average fill would be meaningfully worse than the number you clicked. A simulator that hands you all thousand at 176.24 has quietly deleted the most expensive lesson in the session.
We wrote about the mechanics of the depth window separately in our guide to Level 2 data if you want the panel explained field by field.
Reading the Tape Is the Part Most Simulators Skip
The order book shows you intent. The tape shows you what actually happened. Prints hitting the ask repeatedly means buyers are paying up. Prints going off at the bid means sellers are hitting into whatever is there. When the tape speeds up and the prints get larger at a level that has held three times already, something is about to give.
You cannot learn this from a daily chart, and you cannot learn it from a delayed feed. You need the prints in sequence at the speed they arrived, which means either sitting in the live market every day for a year or replaying sessions until the pattern recognition builds. Our tape reading guide goes through the specific reads worth practicing.
This is also the strongest argument for replay over a paper trading account. A demo account gives you one session a day and most of a trading day is chop. If you want thirty repetitions of a level holding on a heavy tape, replay gets you there in a week. Waiting for the live market to serve them up takes months.
Order Types, and Why Fills Are the Whole Game
The SEC’s plain English summary of the main order types is worth two minutes of anyone’s time. A market order guarantees execution but not price. A limit order guarantees price but not execution. A stop order becomes a market order once your stop price trades, which is precisely why stops fill badly in fast markets.
Those three sentences are easy to memorize and hard to internalise. What builds the instinct is placing a stop, watching it trigger into a gap, and seeing the fill come back four cents below where you set it. In a simulator that costs you nothing except the note you write down afterwards.
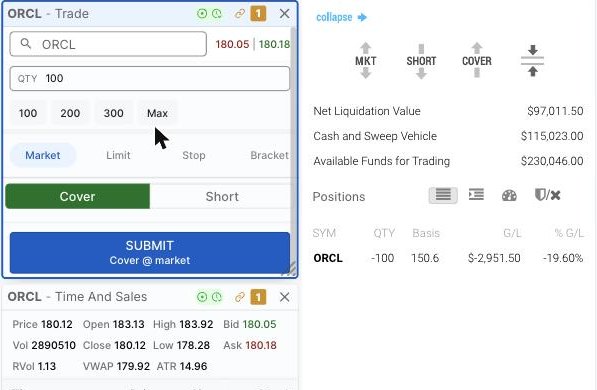
That position is a genuine mistake left open in a practice account, and it illustrates the feedback loop better than a winner would. Position sizing is what keeps a loss like that survivable, and we cover the arithmetic in the position sizing guide.
Practicing the Short Side
Most people learn to trade long and then discover the short side behaves differently. Borrow availability, the uptick restriction on stocks that have fallen far enough in a day, squeezes that run further than any chart suggests they should. The risk profile is not symmetrical, and the emotional experience of a position moving against you with no ceiling is not something reading prepares you for.
A simulator is the sane place to find that out. Run the short side on names that actually fell, and on names that looked like they were falling and then reversed hard. Our guide to short selling covers the mechanics; the simulator is where you get the reps.
The Margin Rules Changed in June 2026
This is the part where most articles on stock simulators are now out of date, so it is worth stating carefully.
For years, the constraint on smaller accounts was the pattern day trader rule. FINRA defined a pattern day trader as any customer executing four or more day trades within five business days where those trades made up more than six percent of total trades in the margin account over that period, and anyone designated had to keep at least 25,000 dollars in equity and trade in a margin account.
That framework is being replaced. FINRA has adopted new intraday margin requirements that supersede the day trading margin rules, including the pattern day trader provisions, effective 4 June 2026, with a transition period running to 20 October 2027 for firms that need longer. Under the new standard there is no 25,000 dollar minimum equity requirement for day trading and no pattern day trader designation based on counting trades. Instead your firm monitors whether your account holds adequate equity during the trading day relative to your actual positions, and an intraday margin deficit has to be satisfied promptly. FINRA sets this out in its investor note on the new intraday margin requirements, and the SEC has updated its pattern day trader glossary entry to match.
The practical point for anyone reading this in 2026: your broker may still be running the old regime during the transition, so check with them rather than assuming. And whichever regime applies, none of it constrains a simulator. Simulated repetitions are not capped by equity requirements, which is the whole reason a practice account is the cheapest place to accumulate screen time.
Where Wyckoff Fits for Equities
Wyckoff’s framework was built on stocks, and it holds up on a replay screen better than most things from that era because it is fundamentally about the relationship between price and volume rather than about a specific indicator setting.
The useful drill is to load a session where a stock spent hours going sideways on declining volume, then run it forward and watch what happens when volume returns. You are looking for whether the range resolves with participation or without it. A breakout on volume that dries up immediately is a different animal from one that keeps expanding, and on a static chart the two look identical after the fact. In replay you see them develop in real time, which is the only way that distinction becomes usable.
Our Wyckoff method guide covers the phases in detail. For simulator practice, the accumulation and distribution reads are the ones that transfer fastest, because they are about supply and demand at a level rather than about a pattern shape.
How to Run a Stock Session That Transfers
Loading a replay and clicking around for an hour is not practice. It feels productive and it teaches nothing. What works is narrower than most people expect.
Pick one setup. Not three. Load sessions where that setup appeared and sessions where it looked like it appeared and then failed, because the failures are where the discrimination gets built. Before each entry, write down the level you are trading against and what would tell you that you are wrong. Take the trade. Note the fill against what you expected. Then move on rather than replaying the same twenty minutes until you get a version you like.
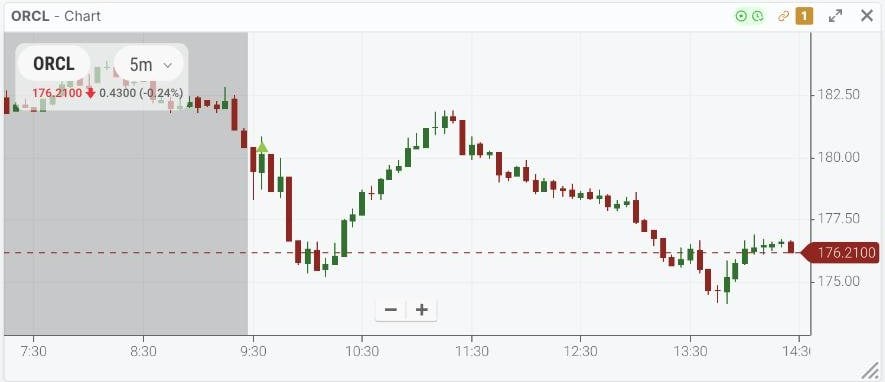
That Oracle session is a good example of why single-session practice is misleading and repetition is not. The morning rally and the afternoon fade look similar for the first three bars each. The only thing that separates them is what volume and the tape were doing underneath, and you need to have seen that comparison many times before it becomes a read rather than a guess.
Two review habits are worth more than extra screen time. Log every trade with the reason for entry, and go back at the end of the week to check whether the reasons cluster. If your losers all share a reason, you have found something. If your winners are random, you have found something less pleasant but more useful.
What TradingSim Covers, and What It Does Not
Being straight about this saves everyone time. TradingSim simulates equities and futures. You can replay listed stocks with Level 2 depth and time and sales, place market, limit, stop and bracket orders, run multiple charts and timeframes, and review your trade log afterwards. The futures side is covered in the futures simulator guide.
There is no options simulator and no forex simulator. If you are trying to practice options spreads or currency pairs, this is not the tool and I would rather say so now than have you find out after signing up.
If your focus is specifically intraday equities, the day trading simulator guide goes deeper on session structure, the open, and intraday risk than this page does.
Frequently Asked Questions
What is a stock trading simulator?
It is software that lets you place buy and sell orders on stocks against real market data without risking money. Replay based simulators load a historical session and play it forward, so you see the same order book, spreads and volume that existed on the day and place orders into them.
Is a stock trading simulator the same as paper trading?
Not quite. Paper trading usually means a demo account connected to the current live or delayed market, so you get one session per day. A replay simulator lets you load any past session and run it as many times as you want, which removes the calendar as a limit on how many repetitions you can get.
Do I still need 25,000 dollars to day trade stocks?
Not under the new rules. FINRA replaced the day trading margin requirements, including the pattern day trader rules and the 25,000 dollar minimum equity requirement, with intraday margin standards effective 4 June 2026. Firms have until 20 October 2027 to transition, so your broker may still be applying the old rules. Ask them directly.
Does practicing in a simulator actually improve live results?
It improves the parts that are mechanical: order entry, reading depth, recognizing a setup quickly, sticking to a stop. It does not replicate the emotional weight of real money, and anyone who tells you it does is selling something. Treat it as the place you make your mechanical mistakes cheaply, not as a full substitute for live experience.
Which stocks should I practice on first?
Liquid, well known names with tight spreads and consistent volume. Thin stocks teach bad habits early because the fills are erratic and it becomes hard to tell whether a bad outcome came from your decision or from the spread. Once your process is stable on liquid names, widen out.
How long should a practice session be?
Shorter and more focused beats longer and vaguer. Forty five minutes on one setup, with notes, will do more than three unstructured hours. The constraint on learning is quality repetitions and honest review, not hours logged.


