S&P 500: The Big Hurdle, Week Starting 13th May (Technical Analysis) (SP500)

cemagraphics
Last weekend’s article warned to get “Ready for the Squeeze” and concluded there are “good odds of a move higher” in the S&P500 (SPY). This played out to a point, but the move higher exceeded my expectations and now looks more than just a short squeeze. Wednesday’s session had a chance to form a reversal with a gap down, but when that failed, it set up continuation and a strong Thursday and Friday for the third week in a row.
The rally has now reached 5439, just 25 points shy of the all-time high. Will this be a big hurdle? This weekend’s article will look at probable reactions as price returns to the previous top. Various techniques will be applied to multiple timeframes in a top-down process which also considers the major market drivers. The aim is to provide an actionable guide with directional bias, important levels, and expectations for future price action.
S&P 500 Monthly
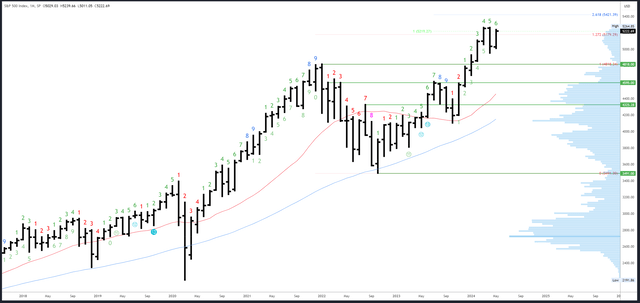
The weak high created by the strong close in March and Q1 has provided a bullish bias. New highs have always been likely; it was just a question of when. Recent strength suggests this can happen as soon as this month, and 5264 should not prove too much of a hurdle as the 5256-64 area has been tested three times already.
Should the rally break-out, there is not much in its way. 5300, and the Fibonacci extension at 5421 are potential targets.
A reversal could develop if the May bar were to break out above 5264, then fail and drop back into the lower half of its range.
The 5264.85 high is the only resistance.
April’s low of 4953 is minor support. 4853 and 4818 are major levels below there.
May is bar 6 (of a possible 9) in an upside Demark exhaustion count.
S&P 500 Weekly
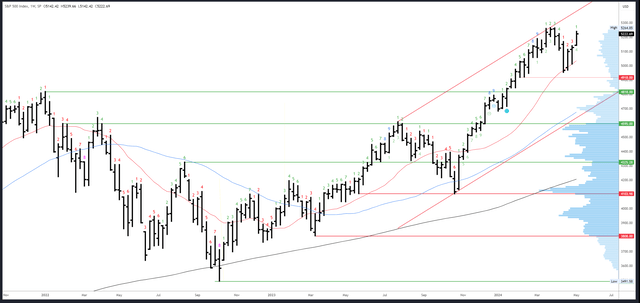
Any lingering doubts about the sustainability of this rebound were put to rest this week. A higher high, higher low and higher close were all made, and the close was comfortably outside the range of the large down bar in the week of 15th April, i.e. above 5168. Continuation higher is likely next week.
The 5264 high is potential resistance, but we can see the highs of three weekly bars near that level. This illustrates price was not rejected strongly and is further evidence the 5264 high is weak.
This week’s gap higher created potential support at 5128-42. The 20-week MA is the next important level below there.
The developing downside Demark exhaustion count has been aborted. Next week will be bar 2 (of 9) in a new upside count.
S&P 500 Daily
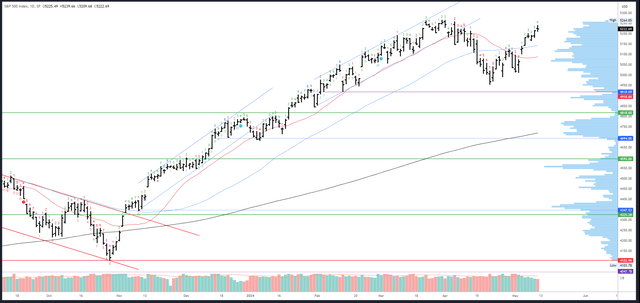
The rally has been skipping over potential resistance with gaps over the 20dma and the 50dma, a bit like the bullish behaviour back in November. As mentioned in the intro, Wednesday’s session had a window for a reversal as it was potentially forming a “bearish abandoned baby” candlestick pattern, which is one of the most powerful reversal patterns. When that pattern failed, it was a pretty clear indication bulls were back in charge.
There is the potential for another “bearish abandoned baby” pattern to form should Monday’s session gap below (and stay below) 5209. This should lead to at least 5142-65 if it plays out.
5256-64 is obvious resistance at the highs.
The first good support is 5165 at Wednesday’s low, then weekly support and the 50dma at 5142.
An upside Demark exhaustion signal will be on bar 7 (of 9) on Monday. A reaction is often seen on bars 8 or 9 so Tuesday/Wednesday could see a pause and dip to support.
Drivers/Events
Softer data continued this week. Unemployment Claims came in at +231K, the highest since last August. This led to a positive reaction as it encouraged dovish expectations from the Fed. The UoM Consumer Sentiment miss, on the other hand, led to weakness. Is the US consumer finally tapped out? Retail sales data next week will be interesting.
Next week’s main event is the CPI release on Wednesday, which is expected to moderate to 0.3% from 0.4%. PPI is due for release on Tuesday, when Fed Chair Powell also talks.
The current rally is still being driven by the Fed’s resolute dovish stance and cooling data. There are plenty signs the economy is slowing and inflation should come back down again, which is all fine and well as long as the weakness is contained. However, take note if the market maintains a sell off on weak data – it could be a tell that concerns on the economy outweigh dovish tailwinds. Many assume any problems can be quickly reversed with a few rate cuts, but that hasn’t always been the case.
Probable Moves Next Week(s)
At this moment, there are no bearish signs to report. 5264 will be the level on everyone’s radar, but it shouldn’t be such a big hurdle for the rally; new highs have always been probable at some point. A break should target 5300, even 5421.
Of course, the route higher may not be straightforward, especially with Powell and CPI on Tuesday/Wednesday. A daily exhaustion signal is due around the same time. Support is at 5165, with 5142 an important spot at this week’s low and the 50dma. As long as 5142 holds, the edge remains with the bulls.
Bigger picture, the odds of a drop back to 4818 now seem slim. Personally, I won’t do any serious buying in my long-term account until back below there. In the meantime, I will have to pick my trades carefully and try to ride this crazy bull market higher.


