Sharpe Ratio: Formula, Examples, and What’s Good

In this article, I will cover the Sharpe ratio indicator and if it’s something you can use to track your trading performance. While this ratio is often used for institutions, you can also use it to raise your game. Remember, even if you are trading out of your home, you need to treat your trading like a business.
The ratio measures a fund or an individual’s returns after factoring in risks. The ratio is named after its founder, William Sharpe, a Nobel Laureate winner.

William Sharpe
William Sharpe first mentioned the ratio in the 1966 paper titled “Mutual Fund Performance”.
In layman terms, for every one point of return; you are risking “x” units. In this statement, “x” represents the Sharpe Ratio which we will detail in the section below.
#1 – How to Calculate the Sharpe Ratio
The ratio is calculated by subtracting the 90-day Treasury bill (risk-free) return from the fund’s returns. If you are trading for yourself, replace the word fund with you.
The result is then divided by the fund’s standard deviation. This resulting Sharpe ratio is expressed in a percentage basis.
For example:
- 12% return
- Standard deviation of 0.08
- T-bill return of 5%
(0.12-0.05)/0.08 = 0.87 Sharpe ratio.
Another way of saying this is to achieve 1 point of return, you would risk 0.87 units.
#2- Comparing Funds
Let’s say Fund A and B both have returns of 22%.
Fund A has a Sharpe ratio of 1.06 and Fund B has a Sharpe ratio of .98.
Which of these two funds offers a higher return when compensating for risk?
Since Fund A has a higher Sharpe ratio, we know that the Fund was able to achieve the same level of return with less risk.
An important distinction to make here is that a higher Sharpe ratio only measures the returns based on the risk.
The ratio does not speak to the level of volatility of the underlying asset.
#3 – How to Evaluate Investment Opportunities
The ratio is most known as a tool for selecting funds. As an example, check out the table below.
Each fund has an equal expense ratio. So, how do we determine the best fund to invest?
This is where the ratio comes into play. The WellsFargo:ST HY B (STYIX.O) has a Sharpe ratio of 1.49, which is the highest in the table.
This means the fund offers you better returns when adjusted for volatility.
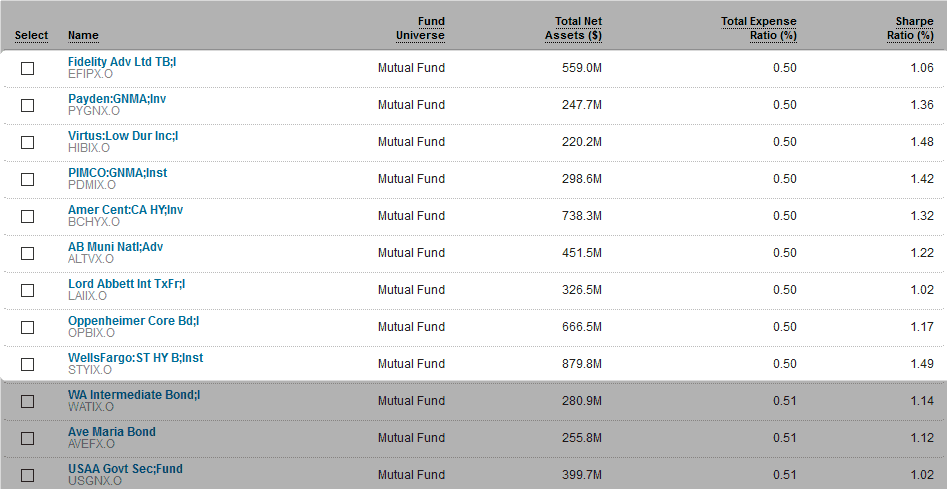
Mutual Funds and ETF Screener (Source – Reuters Funds Screener)
#4 – Major Drawback of the Ratio
The biggest drawback of the ratio is the lack of volatility data.
For example, a fund could have a Sharpe ratio of 1.5. But what does 1.5 mean?
Again, this is based on the standard deviation of the indicator. Therefore, you could invest in a fund that purchases leverage ETFs, hence the portfolio swings will be greater.
Again, just looking at the ratio in isolation will leave out this glaring fact.
Key Financial Ratios
#5- Sharpe Ratio Limitations
Illiquid Assets
Illiquid assets can lower the overall portfolio’s standard deviation, which can impact the Sharpe ratio.
Lagging Indicator
The Sharpe ratio accounts for the historical distribution of returns and volatility. Therefore, the ratio provides no indication or forecast of future risks and returns.
Treasury Market as Benchmark
Let me first say, you have to use some sort of benchmark in order to measure performance. With that said, should the Treasury markets be that benchmark?
There are some that feel the benchmark should be tied to the S&P 500. But remember, the goal for Sharpe was to identify a risk-free rate of return for measure.
#6- Should Day Traders Care About the Sharpe Ratio?
The ratio is a great indicator to track the volatility of a company.
However, as a day trader, I never see myself scrolling thru Sharpe ratios to determine whether I will pull the trigger.
Check out the below table to see if I’m lying.
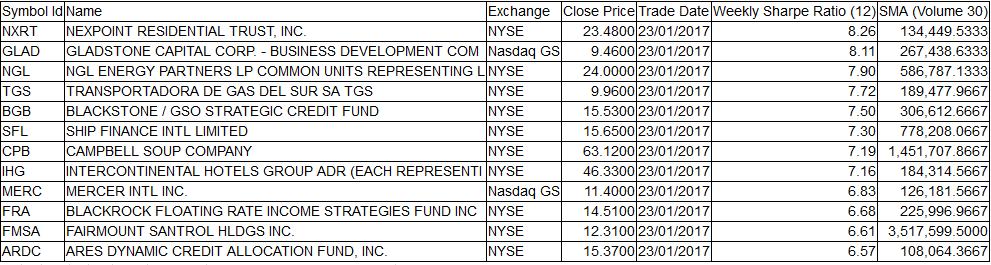
Stock Screener
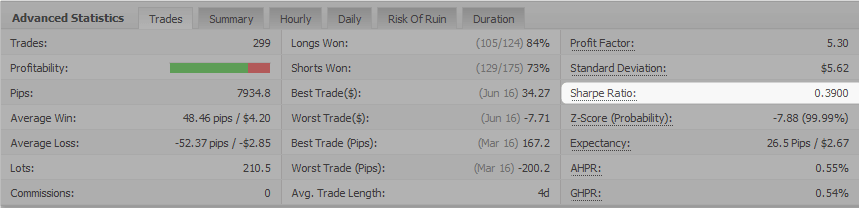
A better use of the ratio is to measure your own day trading performance.
Log into your trading platform. Pull one of the custom reports and look for one that measures your Sharpe ratio.
Now, pull this number week over week to see how risky you are with your money.
What’s New in This May 2026 Update
This guide was last reviewed and refreshed on May 07, 2026. The historical material below remains accurate; in this revision we added a quick-reference summary at the top of the article, expanded the FAQ for Sharpe ratio questions traders search most often, and added cross-links to related TradingSim guides. The original analysis and examples are unchanged.
Quick answer: The Sharpe ratio measures risk-adjusted return: (portfolio return − risk-free rate) ÷ standard deviation of returns. It is expressed as a decimal number, not a percentage. A Sharpe ratio above 1.0 is considered acceptable, above 2.0 is very good, and above 3.0 is excellent. For active day traders, a positive Sharpe over a meaningful sample size (100+ trades) is a more useful baseline than chasing a specific threshold.
Frequently Asked Questions About Sharpe Ratio
What is a good Sharpe ratio for a day trader?
Generally, anything above 1.0 is considered acceptable, above 2.0 is good, and above 3.0 is excellent. Many professional day traders target 1.5-2.5 over a calendar year. Below 1.0 means the return per unit of risk may not justify trading versus a passive benchmark.
Is the Sharpe ratio a percentage?
No. The Sharpe ratio is a unitless decimal number. It expresses how many units of excess return you earn per unit of volatility. A Sharpe of 1.5 means 1.5 units of excess return for every 1 unit of standard deviation in your returns.
What is the difference between the Sharpe and Sortino ratio?
The Sharpe ratio uses total standard deviation as its risk measure, penalizing both upside and downside volatility. The Sortino ratio replaces total standard deviation with downside deviation only, so it does not punish you for big winning days.
How do I calculate the Sharpe ratio for my trading account?
Take your average periodic return (daily or monthly), subtract the risk-free rate over the same period, and divide by the standard deviation of those returns. Annualize by multiplying by √252 for daily returns or √12 for monthly returns.
Is the Sharpe ratio reliable for short-term traders?
It can be misleading on small samples. With fewer than ~30 observations, the standard deviation estimate is too noisy to trust. For active day traders, build the Sharpe ratio from at least one full quarter of returns, ideally a year, and pair it with maximum drawdown for context.
Related TradingSim Guides
Practice Before You Trade Real Money
The fastest way to internalize any concept in this guide is to test it on real historical price data. TradingSim is the leading replay-based simulator for stock and futures traders — rewind any market day, drop in your setup, and see exactly how it would have played out. Practice futures trading with realistic margin and contract behavior, or run unlimited equity simulations against tick-level historical data.


