Ride Momentum in 2026 [Updated April 2026]

Trend Trading Overview
Trend trading is the practice of riding a security during a strong move up or down.[1] Now, what one person calls a trend can vary from trader to trader.
For example, a penny stock trader may expect a massive move higher of 20% or more intraday before considering a stock in an uptrend.
Conversely, a low volatility trader may need minor price expansion before declaring a new trend in play.
Whatever the time frame or strategy, the goal with trend trading is to identify the trend and find a way to jump on board with least amount of risk. To that end, in this post will discuss a few of these strategies and reveal how you can scan for trending stocks.
First, let’s talk about to discover the trend.
Trend Trading Indicators
When trading, the less subjectivity you have about the markets the better. Therefore, you can use technical indicators to gauge market trends.
Trend lines
Trend lines are a great way to clearly define the market trend. This can still prove to be somewhat subjective as you are required to identify the start and endpoints for the lines. But for all intents and purposes, with a little practice you should be able to identify the prevailing points of support and resistance for a clear trend.
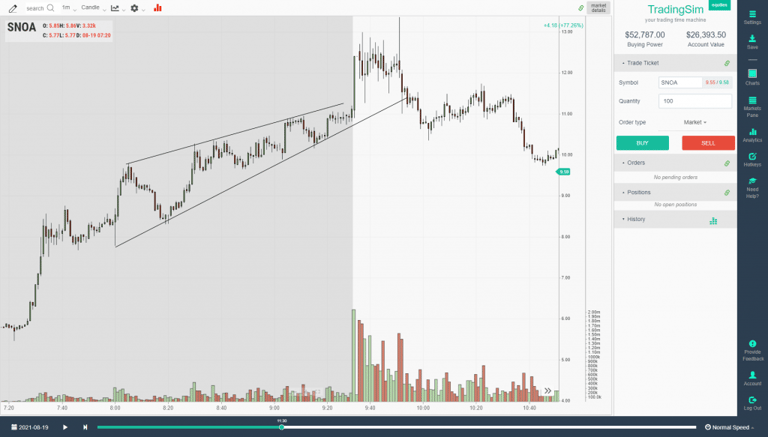
For bullish trends, you want to connect the low points and high points to develop an up channel. [2] After all, an uptrend is only confirmed once you have a series of higher lows and higher highs.
As the stock is on its upward trajectory, the stock should not breach the prior low on its way up.
Likewise, for a bearish trend you’ll simply reverse your low and high points.
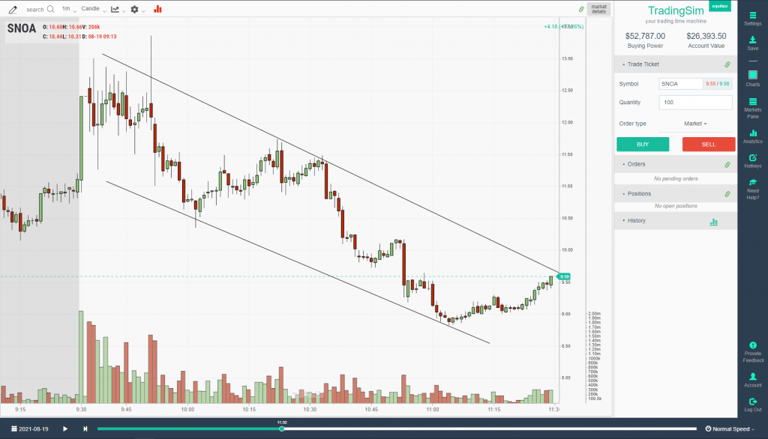
Notice that this is the exact same stock, just on the backside of the intraday trade. Trends can really help uncover which side of the trade you’re on. And the great thing about trend lines is that the more you draw with them, the more you train your eye to anticipate the direction of a stock.
This can help with setting targets and reversals as your trading develops.
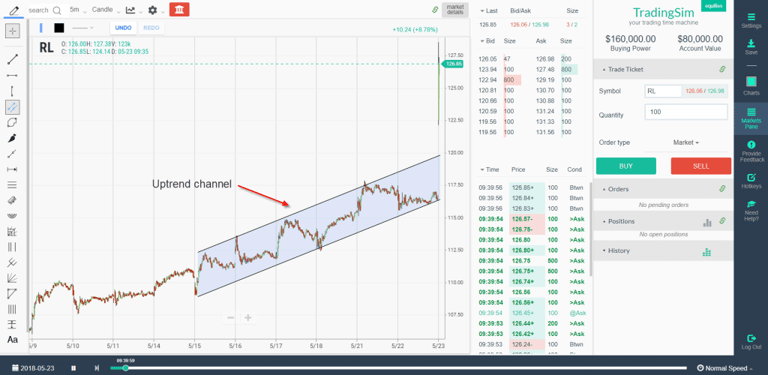
Trend Channels
To take it a step further, you can use the trend channels drawing tool. These channels create a clean parallel line. However, these channels will not allow you to create wedge patterns or diamond formations.
Often, trend channels work best for more natural price action in larger cap stocks: bigger, more liquid companies.
Slope of the Line
The other point to note is that you need to identify a minimum slope of the line, which will trigger a trend for you.
A strong trend will usually have a slope north of 50 degrees to generate the level of an impulse move higher.
This is completely subjective. Nonetheless, if you are trend trading, the move should be strong enough for you to care.
Moving Averages
Moving averages are another great indicator you can use to measure the strength of a trend.
On the bigger time frame, you can take the simple approach of waiting to see if the stock is above or below its 200-day moving average. However, another approach is to look for a strong trend where the averages do not intersect on the way up. This spread of the averages shows you that the stock is trending hard for all periods (short and long).
To that point, we’ve created a scanning filter in the TradingSim application that, when checked, will eliminate stocks on a daily chart whose 20, 50, and 200 moving averages are stacked on top of each other. In other words, the 20 is above the 50, and the 50 is above the 200.
This tells us that the shorter time frames are above the longer time frames, revealing the uptrend. Of course, reverse this and you get a downtrend.
Here is what that scan filter looks like:
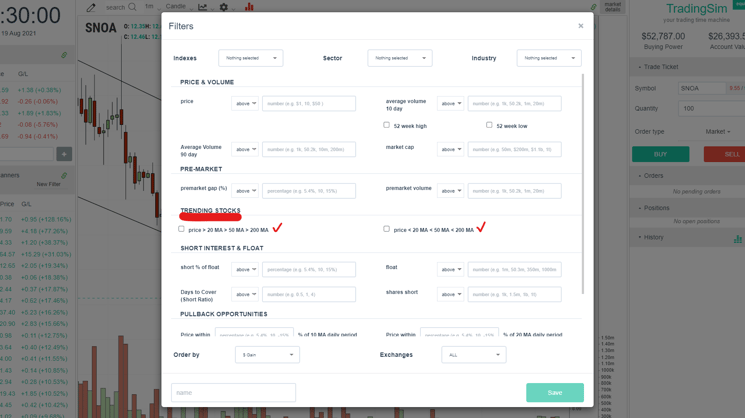
When one of these is checked, it will filter the results to only those stocks trending bullishly or bearishly.
You may be thinking, “why is this important?”
Well, the great thing about trending stocks is that they can offer short term traders great opportunities with pullback buys. If you’re not familiar with this strategy, be sure to check out our post on the 20 Moving Average Pullback.
Example of an Up-trending Stock
To illustrate the results from the scanning filter, here is just one stock that was populated from that list.
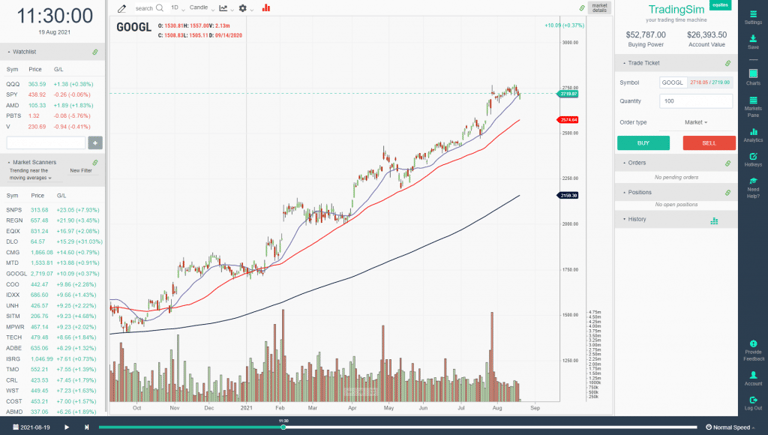
From the chart above, you can see that the purple 20 moving average is trending nicely above the red 50 moving average. And, down below, the 200 moving average is pointing upward as well.
All three are in alignment giving us the indication that the trend is strong.
Example of a Non-trending Stock
Now that you know what a strong uptrend looks like, notice the difference between GOOGL and this XNCR trend.
Plenty of chop, right?
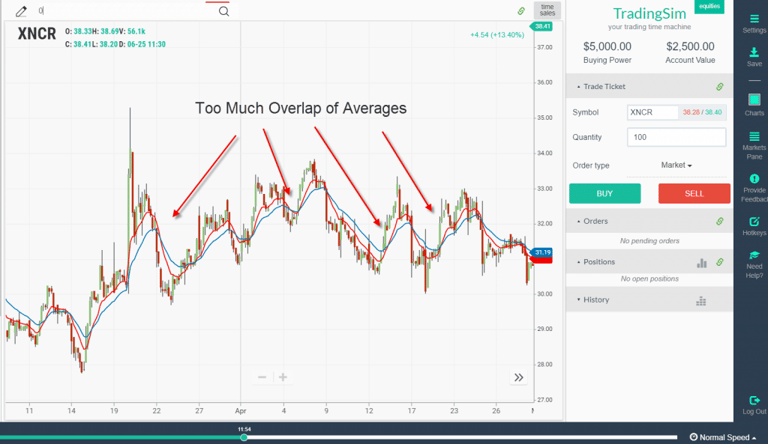
The above chart has two moving averages the 10 and 20 EMA. You can see the level of backtesting the 10 has with the 20, which is a clear sign the stock is not trending hard.
Example of a Down-trending Stock
ABIO has a clear sell off after reaching climactic highs around $18. From there the stock never recovered.
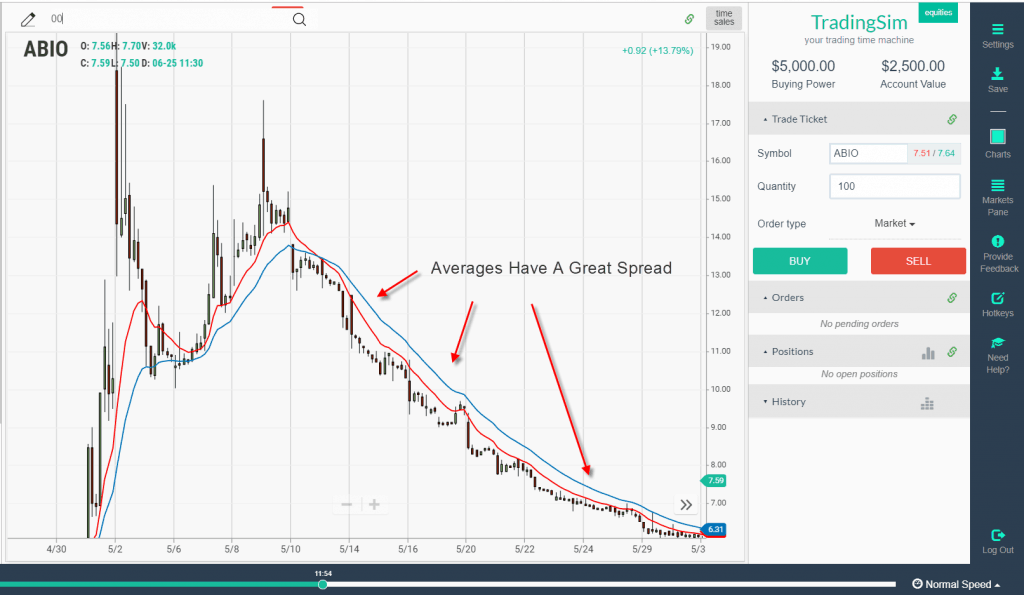
The above chart is a clear example of when a stock is trending really hard. Notice how the averages do not cross at all. To add more validity to the trend, the averages are also far apart all the way down.
Just to level-set your expectations, these sort of trends are hard to find. You certainly don’t want to be on the wrong side of this trade. And, unfortunately, some selloffs never pullback for low risk entries.
Momentum Oscillators
Another indicator you can use to analyze the markets are momentum oscillators. These indicators have no upward or lower bound which allows the oscillator to run with the stock. [3]
The TRIX indicator is a momentum oscillator that moves above and below a zero line. In the next chart, we will cover a stock that is in a strong downtrend.
As this stock continue its downward momentum, notice that the TRIX is practically living below zero.
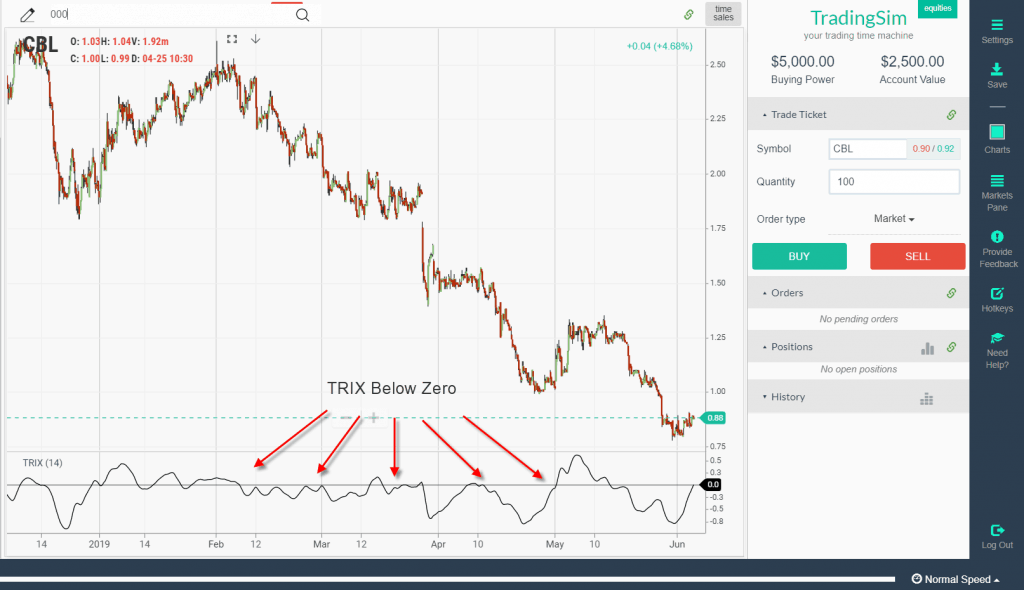
That being said, the TRIX does not react quickly because it smoothes out three exponential moving averages, so it’s a great indicator for measuring trends.
Notice how as the stock moved lower the TRIX respects the zero line. This does not mean there aren’t moments when the TRIX breaks zero by a hair or two.
Remember, in the market rarely does the price action fit nicely into a box dictated by technical analysis books.
More Trend Trading Examples
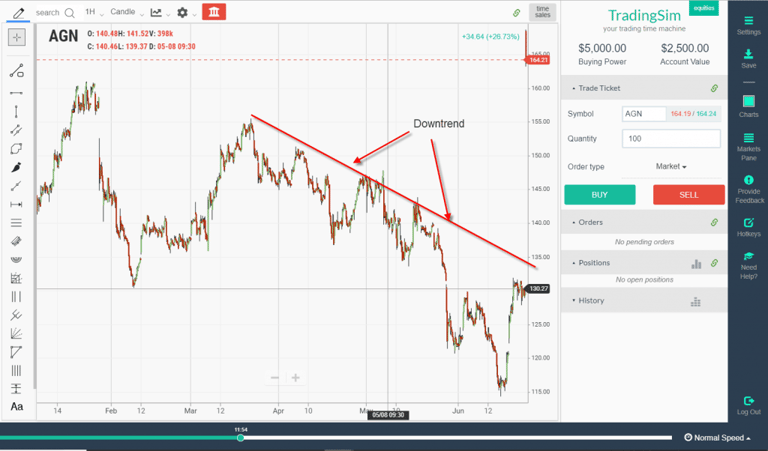
For our first example, we have a stock in a clear downtrend. You can see how the stock is making lower lows and lower highs.
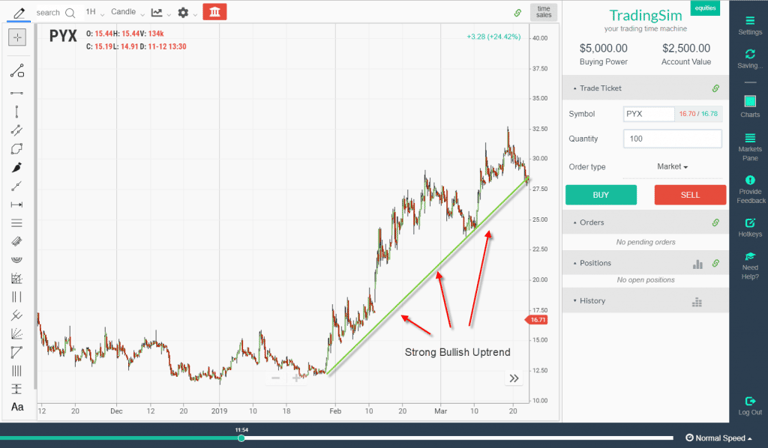
Next up, we have a strong bullish uptrend with higher highs and higher lows.
Hopefully examples are helping you to see the difference. How about one more:
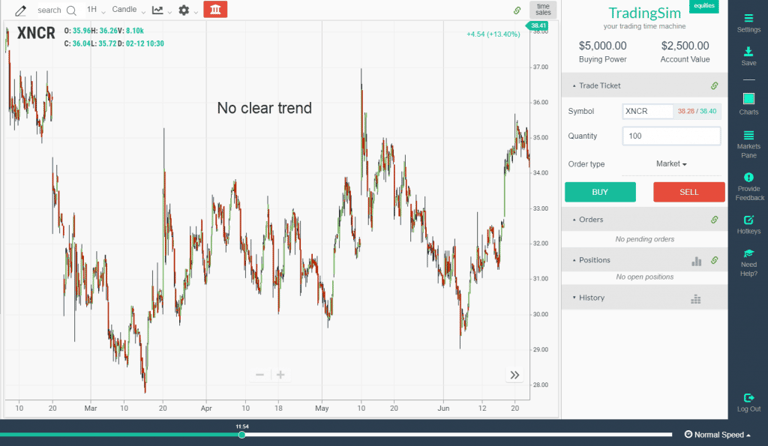
Can you see how the above chart lacks any trend? This is what we would call a choppy market or a security that lacks a clear trend. Most of these stocks are range bound.
Where Trend Trading Fails
Trend trading is like any other strategy in the markets. There will never be a 100% success rate. Often times a bullish trend will fail when a stock has reached a climax top, overthrows its channel, or supply becomes too heavy.
Conversely, a down trend will end when a stock has a climactic selloff, or demand comes in to support the stock.
The key is to study the trends to find consistencies in the volume and price action. [4]
Not Honoring Your Stops
When you are trading a stock that is trending, it feels great. You don’t have to do much and the money just flows into your account. However, if you jump into a trending stock at the time it reverses, you can find yourself in a pickle.
This is because being late to the party can lead to a nasty reversal as the stock could drop back down to its origination point.
So, you have to use your stops or the trending move will become your worst nightmare.
If you find yourself buying at a top of a strong trend, do not add to the position as it violates each swing low on the way back down. This is called averaging down, and it can be devastating.
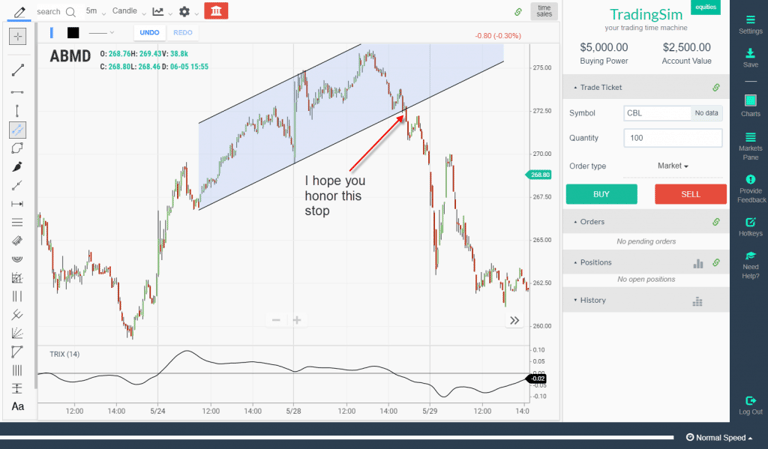
In the above chart example, we’re pointing out what happens if you were to buy support in a channel of a strong uptrend that fails.
As you can see, if you did not place a stop below the low of the test, things got ugly fast and in a hurry.
Strategies to Join a Trend
Now that you know what not to do, let’s look at a few strategies to help you join the trend.
The Moving Average Pullback
Many times during a strong trend, stocks will pullback to an important moving average like the 20 or the 50 moving average. These pullbacks can provide a great opportunity to join the trend if it continues higher, all while keeping your risk low.
Because institutions love to buy at lower prices, often stocks will find support at this levels.
Let’s use our GOOGL example from above and see how buying at the 50 moving average would have been a great decision.
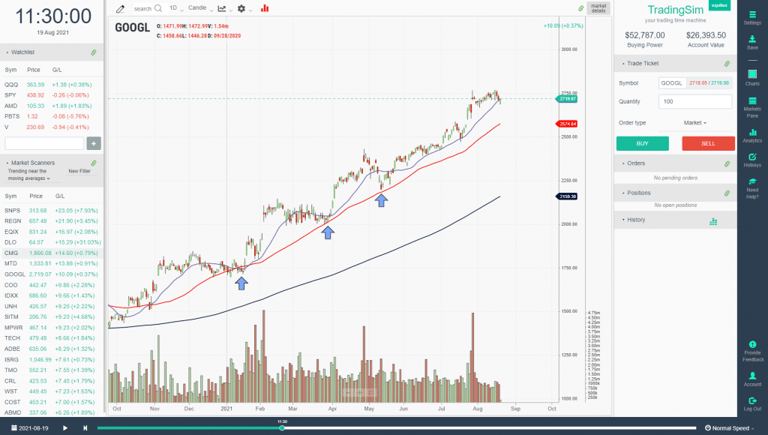
We were given three great opportunities to buy the pullback in GOOGL at the 50 moving average, noted by the arrows on the chart. Each one of these buys would have been a great opportunity to profit.
You could have placed a stop loss just below each consolidation if the trade didn’t work out for a small risk.
Mean Regression Trend Trading
If you don’t like using the moving averages, sometimes a channel works better. Taking the moving averages off the chart of GOOGL, we’ll add a channel this time.
Notice how the buys correspond with the channel lows, and the sells correspond with an overthrow of the channel highs.
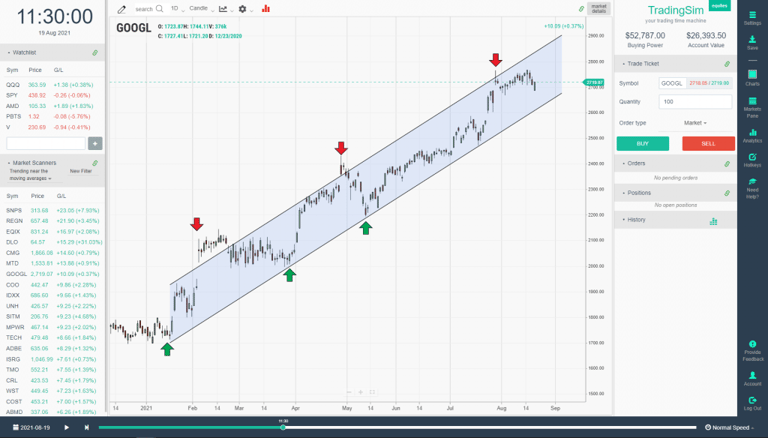
This can be a great and easy way to manage short-term positions. Basically, you’re buying the dips at support, and selling the rips at the highs.
How Can Tradingsim Help with Trend Trading?
If you are looking to practice trading trending stocks, it will come down to your entries, stops and the method of choice. Whether it’s moving averages, channels or oscillators, you’ll need to master each method in order to develop an edge.
This is where you can use Tradingsim to practice with over 11,000 stocks and 1,000 ETFs. Be sure to drop us a line and let us know how your edge is developing!
External References
- Peterson, Nathan. The Trend Is Your Friend: A Guide to Trading Trends. schwab.com
- Perfect Stock Alert. (2011). Bull Price Channel Chart Pattern. YouTube.com
- Oscillators. Wikipedia.com
- Etiology Of Human Errors In Trading. (2016). seekingalpha.com
Quick Answer: What is trend trading and how does it work?
Trend trading is a strategy that enters in the direction of an established price move and holds the position until the trend shows objective signs of ending. The setup has three required components: a trend filter (price above a rising 50 EMA for longs, below a falling 50 EMA for shorts), a pullback entry (price retraces to the moving average or a prior swing), and an exit trigger (a close below the filter or a 2-bar low trail for longs). Trend traders accept lower win rates in exchange for larger average wins.
Updated 2026-04-24 by Al Hill, Co-Founder of TradingSim. Verified against current TradingSim market replay data.
The Regime Filter: Do Not Trade Trends That Are Not There
Ninety percent of losing trend trades happen because the trader thought a trend existed when the market was actually in a range. A proper regime filter keeps you out of those trades.
My regime filter is three layered checks. First, the 50 EMA must be sloping — up for longs, down for shorts — for at least fifteen bars. Flat EMAs mean flat markets. Second, price must be making higher highs and higher lows (or lower lows and lower highs) on the timeframe you trade. One broken swing is a warning; two is disqualifying. Third, the ADX(14) should read above 25. Below 20, the market has no directional bias worth trading.
Three Entry Techniques That Actually Work
Pullback to the moving average. Price retraces to the 20 EMA (intraday) or 50 EMA (daily) inside an established trend. Entry is a buy-stop one tick above the high of the first bar that closes back above the EMA. Stop is one tick below the pullback low. This is my primary trend entry and accounts for roughly 70% of my trend trades.
Breakout of a continuation pattern. Price forms a bull flag, pennant, or ABCD consolidation inside the larger trend. Entry is the pattern breakout. The trend filter ensures you only take breakouts aligned with the bigger picture. See our guide on bull flag patterns for the breakout mechanics.
Higher-high confirmation. After a pullback, wait for price to print a new higher high (or lower low for shorts). Enter on the next bar’s open. This is the safest entry — you never front-run the trend resumption — but you give up some of the move.
Trend Exits: Where Most Traders Quit Too Early
| Exit Rule | When to Use | What It Captures |
|---|---|---|
| 2-bar low trail (longs) | Intraday trends | 70–80% of the move |
| 3-bar low trail | Multi-day swings | 60–70% of the move, fewer whipsaws |
| Close below 20 EMA | Strong uptrends | Exits on first real structural break |
| ADX below 20 | All timeframes | Exits when the trend objectively dies |
| Measured-move target | Patterns inside trend | 1R to 2R, with partial exit |
Trend trading pays when you sit through pullbacks that look like reversals in real time. If your exit rule fires on every shake-out, you are day trading, not trend trading.
Which Markets Trend and Which Do Not
- Strong trend characteristics: Single-stock runners driven by fundamentals, sector rotations into leaders, futures contracts during policy regime shifts (ES after a Fed pivot, CL during supply shocks).
- Weak trend characteristics: Broad market ETFs on low-volume holiday weeks, single stocks ahead of earnings, any asset during the last hour of a range-bound session.
A tradeable trend has a cause. When you can explain why the move is happening — a catalyst, a cycle, a structural flow — you can hold through pullbacks. When you cannot, the first whipsaw will shake you out.
The 20-Session Trend-Spotting Drill
On TradingSim, replay twenty trading sessions and classify each one: strong trend day, weak trend day, range day, or chop day. Use only the three regime filters above. By the end of twenty sessions you will have a concrete dataset: how often does a trend day show up in your target instrument, what did it look like in the first hour, and what would have kept you from taking trend trades on the range days. This drill builds the one skill that separates profitable trend traders from everyone else — the ability to not trade trends when they are not there.
Frequently Asked Questions
What is the best indicator for trend trading?
The most effective trend filter combines a sloping 50 EMA with ADX(14) above 25 and confirmed higher highs and higher lows (or the mirror for downtrends). No single indicator is enough — you need the EMA to define direction, ADX to confirm strength, and price structure to verify the trend is intact.
How long should I hold a trend trade?
Hold until your exit rule fires. For intraday trend trades, a 2-bar low trail captures roughly 70 to 80 percent of the move before stopping you out. For multi-day swing trades, use a 3-bar low trail or a close below the 20 EMA. Predefine the rule before entering — never hold on hope.
Can I trend trade in any market?
Any liquid market can trend, but not all trend the same way. Equities trend cleanly after earnings beats or sector rotations. Futures trend during policy shifts or supply shocks. Commodities trend on seasonal and macro cycles. The skill is recognizing when a given market is in its trending regime versus ranging.
What is the win rate of trend trading strategies?
Well-designed trend strategies win 35 to 50 percent of the time but average 2 to 4 times the risk on winners. The edge comes from the ratio, not the hit rate. If you cannot stomach losing more trades than you win, trend trading will drive you out of the market — try mean-reversion strategies instead.
What timeframe is best for trend trading?
Day traders use the 5-minute and 15-minute charts for intraday trends. Swing traders use the daily. Position traders use the weekly. Pick the timeframe that matches the hold time you can psychologically handle — if daily candles feel too slow, you will sabotage the trade by checking the 5-minute chart.
Practice This Setup on TradingSim
Reading about trend trading only gets you so far. The shift from concept to instinct happens when you drill the setup across hundreds of sessions. TradingSim’s day trading simulator replays real historical market data tick-by-tick, so you can practice identifying and trading trend trading under live-market conditions without risking a dollar. For futures-oriented traders, the futures simulator covers ES, NQ, CL, and GC with the same realistic replay engine.


