
Bollinger Bandwidth Indicator: Trading Guide

In this article, I am going to cover some basic trading techniques you can use with the Bollinger band width indicator. Before we dive into the strategies, let’s first discuss the indicator.
Bollinger Bandwidth Overview
The Bollinger Bandwidth was first introduced by John Bollinger in the book, Bollinger on Bollinger Bands.
The indicator measures the percentage difference between the upper and lower Bollinger Bands. Most chart engines plot the indicator as an oscillator beneath the price chart.
For a quick refresher, Bollinger Bands encapsulate price and are two standard deviations from the 20-period simple moving average (SMA).
How to Calculate the Bollinger Bandwidth
First, subtract the values of the lower band from the upper band. The difference is then divided by the value of the middle band which is the 20-period SMA.
The result is a normalized bandwidth value.
Bollinger Bandwidth Chart Example
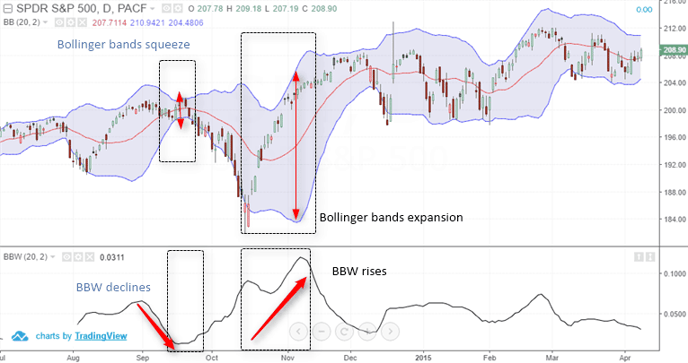
Bollinger bandwidth indicator with Bollinger bands on SPY ETF Chart
In the above chart, when the distance between the two outer Bollinger bands contract, the Bandwidth indicator falls and when the upper and the lower Bollinger Bands expands, the Bandwidth indicator rises.
The Bollinger bandwidth provides a visual of price consolidation (low bandwidth values) and periods of volatility (high bandwidth values).
As a trader, you can zoom out on your chart to get a sense of the volatility within context to prior moves.
Interpreting Bollinger Bandwidth Indicator Signals
When the upper and lower bands are far apart, it indicates the current trend is nearing an end.
Conversely, when the upper and lower Bollinger bands tighten, an impulsive move is likely right around the corner.
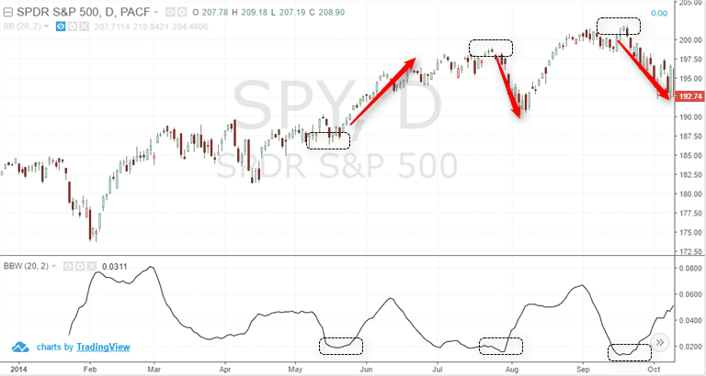
Bollinger bandwidth and market volatility
The above chart shows how lows on the Bollinger bandwidth signal a potential strong move in the markets. In the first instance, the low period of consolidation was marked by a strong breakout in prices.
In the second scenario, the low bandwidth reading called the short-term top and subsequent price selloff.
Lastly, the third example shows triggered a rally.

Bollinger Bandwidth Does Not Forecast Market Direction
As you can see, the low points do not predict which way the market is going to break. You will need to use other analysis techniques to identify your edge.
3 Bollinger Bandwidth Trading Strategies
The most common way to trade with the Bollinger bandwidth indicator is breakouts. As previously discussed, low periods of volatility precede high periods of volatility.
#1 – Bollinger Bandwidth and the Broad Market
According to John Bollinger, the fall in the Bollinger Bandwidth indicator below 2% or 0.02 has led to big moves in the S&P500 index.
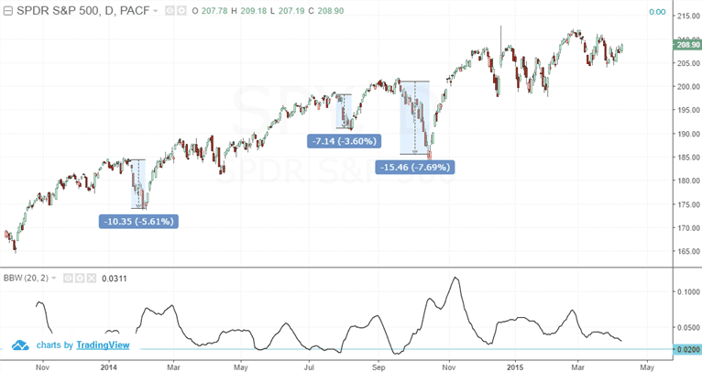
Bollinger bandwidth indicator and the 2% threshold
In all the three instances price fell 5.6%, 3.6% and 7.6% from the short term market tops when the indicator dipped below 2%.
To profit on this setup, you can buy futures contracts or an ETF that mirrors the broad market. To determine your potential profit potential, review prior rallies to determine the mean.
#2 – Double Bottom Trade Signals
In the following chart, we have the SPDR S&P500 SPY ETF intraday chart. Here we can see that while prices posted a low it was marked by a low in the Bollinger bandwidth.
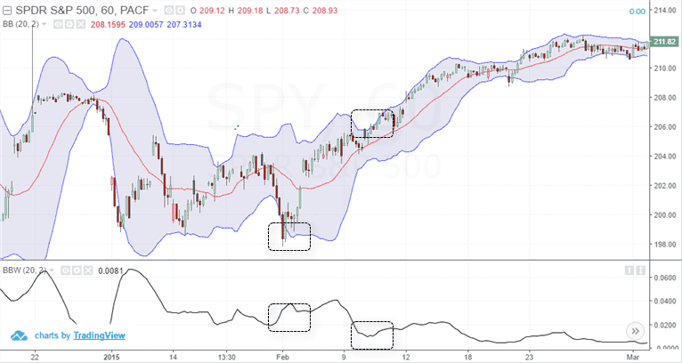
Bollinger bandwidth and price trends
This low was also a test of a prior low with the candle completely outside of the Bollinger band.
So, you have multiple signals confirming the index is oversold. While we only cover double bottoms, you can apply the Bollinger bandwidth indicator to validate other chart patterns.
#3 – Major Trend Reversals
In the below chart of the SPDR 500 the market put in a major low in the first red box. In this setup, you want to wait for volume and price to go parabolic to the downside.
If you notice the volatility easing the initial push could be enough for the security to climb the wall of worry. You can jump onboard the trend with a close stop below the most recent low.
You will want to apply trendlines or another indicator to follow price higher. When you are buying securities with such high volatility on a countertrend move, you have to hold on to your position a little longer, so the risk-reward works out on the trade.
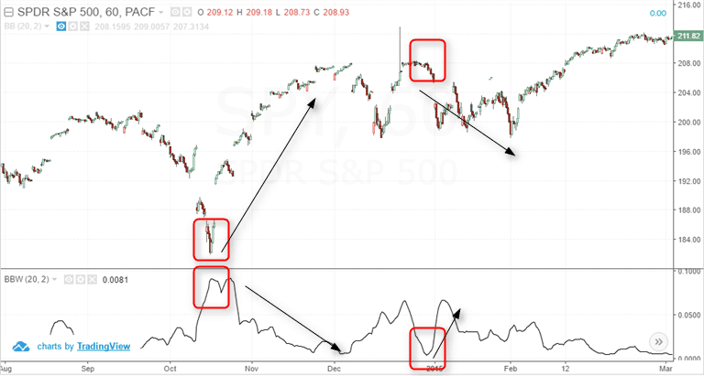
Bollinger bandwidth indicator at extremes
Next up, the market formed a top with another extreme reading of the Bollinger bandwidth indicator.
Here you can go short with a stop above the most recent high. You can trail the position using trendlines or price action.
How Can Tradingsim Help?
If you are thinking about trading with the Bollinger bandwidth indicator, you can do so within Tradingsim. You can practice placing trades and identify which strategy works best with your trading style.
To learn additional Bollinger bandwidth strategies, learn from the master himself – John Bollinger (BollingerBands.com) on his website.
Good Luck!

Frequently Asked Questions
What is the Bollinger Bandwidth indicator?
It’s an oscillator that measures the percentage difference between the upper and lower Bollinger Bands, plotted beneath the price chart. Low readings mean the bands are contracting (consolidation); high readings mean they’re expanding (volatility).
How do you calculate Bollinger Bandwidth?
Subtract the lower band value from the upper band value, then divide that difference by the middle band (the 20-period simple moving average). The result is a normalized bandwidth reading.
What does a low Bollinger Bandwidth reading mean?
A low reading (the bands squeezing together) signals price consolidation and often precedes a volatility expansion — many traders watch for a breakout once bandwidth starts expanding off a multi-week low.
What does an extreme high Bollinger Bandwidth reading mean?
An extreme expansion usually marks a volatility climax. When it coincides with a price extreme (a fresh high or low), it can flag exhaustion and an opportunity to fade the move with a tight stop.
Can I practice Bollinger Bandwidth strategies before trading live?
Yes. TradingSim lets you replay historical stock and futures sessions and practice reading Bollinger Bandwidth squeezes and expansions in real time before risking live capital.


