VBR: This Cheap Sophisticated Ranking Approach Has Failed

syahrir maulana
Vanguard Small-Cap Value Index Fund ETF Shares (NYSEARCA:VBR), launched on 01/26/2004 and managed by The Vanguard Group, Inc., is a value ETF that tracks the performance of the CRSP US Small Cap Value Index.
This ETF is very cheap to hold but fails to capture the level of outperformance usually observed in value ETFs over such long periods. I believe it’s most likely that its methodology doesn’t succeed because of an issue that is usually not present with value ETFs that have outperformed in the long term; complexity. Its valuation is also reflective of that hypothesis. So, let’s take a look.
Methodology
The CRSP US Small Cap Value Index uses the small-cap segment of the U.S. equity market as its available universe and applies some liquidity checks to select the constituents. First, each company’s free float should be at least 12.5% of its total shares outstanding. Second, the index uses a trading score to determine liquidity, which is calculated as trading volume divided by the free float. More specifically, the version of trading volume that it uses is the average daily split-adjusted composite volume of a security and the free float is measured as of the end-of-day 5 trading days up to the ranking day. Third, the index ensures the limitation of trading gaps by only considering securities that have had a sequence of more than 10 days of trading since the last ranking. Last, the index excludes any stock that was suspended for 40 days or more by its listing exchange on the day of ranking.
Now, ranking the constituents is done based on 5 value factors:
1. Book-to-Price Ratio 2. Future Earnings-to-Price Ratio 3. Historical Earnings-to-Price Ratio 4. Dividend-to-Price Ratio 5. Sales-to-Price Ratio
Each factor results in a z-score that is calculated as the cross-sectional differential divided by the cross-sectional standard deviation. The primary issue with this ranking system, in my opinion, is the weights attributed to each factor to arrive at the composite value score, which is arrived at after adding two value “super” factors (V1 and V2) together. For V1, the z-score of the EP ratio is given 2/3 of the weight and that of the BP ratio is given 1/3. The problem with this is that the BP ratio, in general, has more predictive power of excess returns in value investing because the numerator is less volatile and, therefore, more representative of value.
crsp.org
This issue is magnified when you further dilute the impact of BP on the portfolio’s ranking by adding more value factors that are also worse proxies of value, such as the Dividend-to-Price Ratio and Sales-to-Price Ratio, which together constitute the second value “super” factor, V2.
In the absence of competing explanations, I think that the diversification level of the factors here offers us the most likely driver of this fund’s failure to outperform in the long run.
Performance & Cost
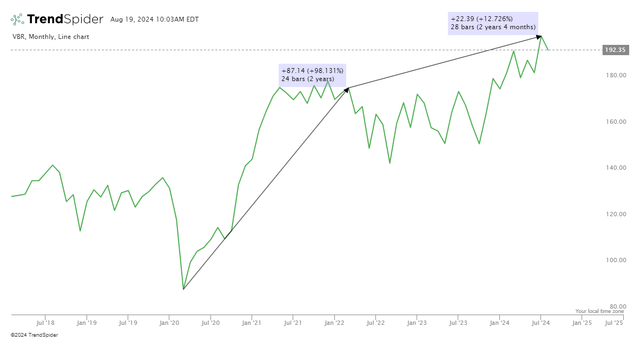
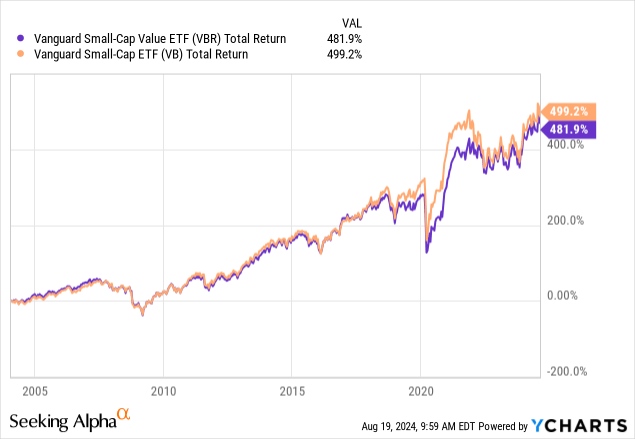
Since it was launched, it realized an annualized return of 9.14%. This is not that good, considering that the Vanguard Small-Cap ETF (VB), which lacks a value bias, has returned 9.29% since that time.
Here is the total return performance differential:
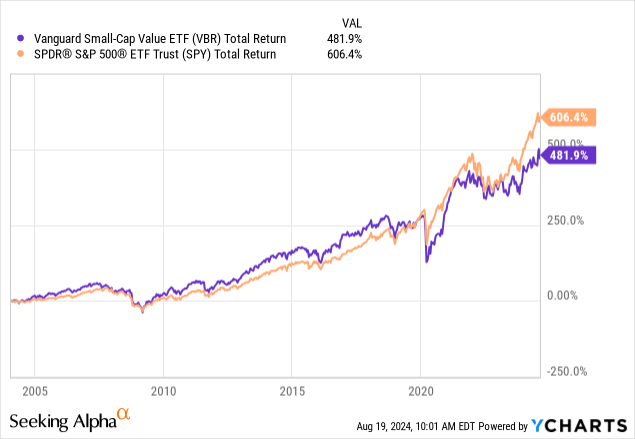
Though it outperformed the large-cap segment of the market for a long time, its drawdown in 2020 was more severe and its recovery slower since then, ending up underperforming recently:
That being said, on an absolute basis it did well when it comes to recovering since its 2020 low up to when the Fed started hiking rates and since then, up until now:
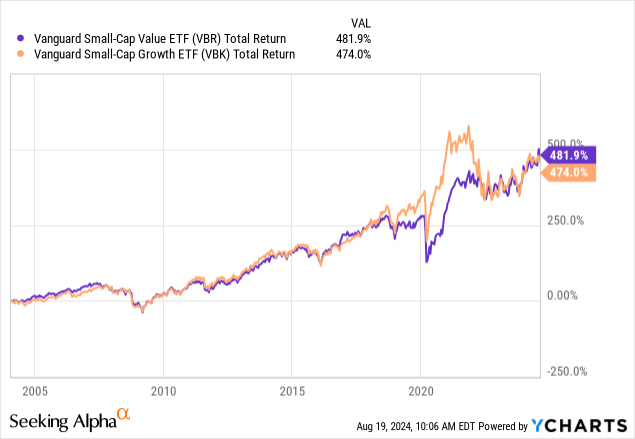
Regardless, the greatest example that it has been unsuccessful is offered by its performance against its growth counterpart, which outperformed and actually had longer periods of outperformance than observed in the other examples above:
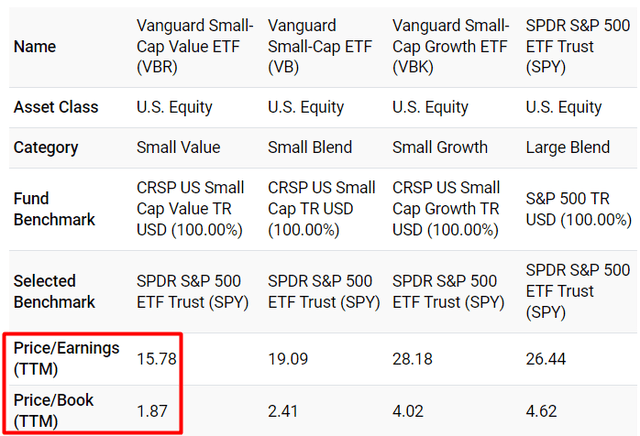
I believe that the relative undervaluation level of VBR is reflective of this trend continuing because it’s not attractive enough:
With value ETFs that have a long track record of outperformance, you usually see an even lower earnings multiple and P/B ratio these days. This is by no means proof that this fund will never start outperforming the alternatives, but I would argue that it had its chances and the valuation, which is reflective of its methodology, doesn’t seem promising.
Of course, this is a very cheap ETF to hold. Its turnover ratio in the last fiscal year was only 16%, and it charges an expense ratio of just 0.07% per year. No doubt, it’s one of the cheapest value ETFs out there. However, is it worth it if it fails to outperform so many of its peers?
Risks
The primary risk for me here is the potential opportunity cost. There are other, a bit more expensive, value funds that have proved that their approach works in the long run by delivering substantial excess returns. Because of this, holding VBR doesn’t make sense to me.
There is also the small-cap risk present here, and it is more significant in this case because you theoretically take more risk for something that the ETF hasn’t achieved thus far. If you’re going to take that risk, demanding a better track record makes sense.
There is also a concentration risk because its portfolio is exposed to Financials stocks by 20.14%.
Verdict
All in all, I think that VBR may still be useful to traders in some cases, but long-term investors may want to look elsewhere to attempt to outperform the market in the long run using the value and size factors. So, I am rating it a hold and encourage you to read another recent article I wrote on SPDR S&P 600 Small Cap Value ETF (SLYV).
Was that helpful? What’s your preference? Please let me know in the comments! Thank you for reading.
