Tourlite Capital Q3 2024 Investor Letter

da-kuk/iStock via Getty Images
To My Partners:
Tourlite Fund, LP returned 4.5% for the Third Quarter of 2024 and 13.8% year-to-date for 2024. The Fund has annualized returns of 11.0% since inception, compared to 11.8% for the S&P 500 (SP500, SPX) and 4.5% for the Russell 2000. 1,2
|
Q3 2024 |
2024 YTD |
Annualized Return 3 |
|
|
Tourlite |
4.5% |
13.8% |
11.0% |
|
S&P 500 |
5.9% |
22.1% |
11.8% |
|
Russell 2000 |
9.3% |
11.2% |
4.5% |
Gross Contribution & Average Portfolio Exposures
|
Gross P&L 2024 YTD |
Q3 2024 |
|||
|
Gross P&L Q3 2024 |
Avg. Dollar Exposure |
Avg. Beta-Adj. Exposure 4 |
||
|
Longs |
33.1% |
18.8% |
93% |
115% |
|
Shorts |
(13.3%) |
(11.5%) |
(70%) |
(96%) |
|
Indexes / Hedges 5 |
(0.3%) |
(1.3%) |
(15%) |
(17%) |
|
Gross Contribution |
19.5% |
6.0% |
Gross: 178% |
Gross: 228% |
|
Net: 9% |
Net: 2% |
|||
Market Outlook
Over the past few quarters, we’ve maintained a cautious stance on the equity market, keeping our near zero net exposure. We continue to see downside risks to earnings expectations, particularly in the consumer sector, and believe valuations remain broadly elevated.
Recently, the Federal Reserve cut interest rates by 50 basis points in response to early signs of a weakening labor market, despite inflation persisting above the 2% target. While the Fed’s focus has shifted from inflation to employment, we see significant risk of reaccelerating inflation.
Looking ahead to the upcoming election, potential market volatility looms. Regardless of whether Trump or Harris wins, both are likely to drive inflation higher through increased fiscal spending and a growing budget deficit. While these fiscal and monetary measures may provide short-term support for equity markets, they also raise the risk of longer-term economic challenges.
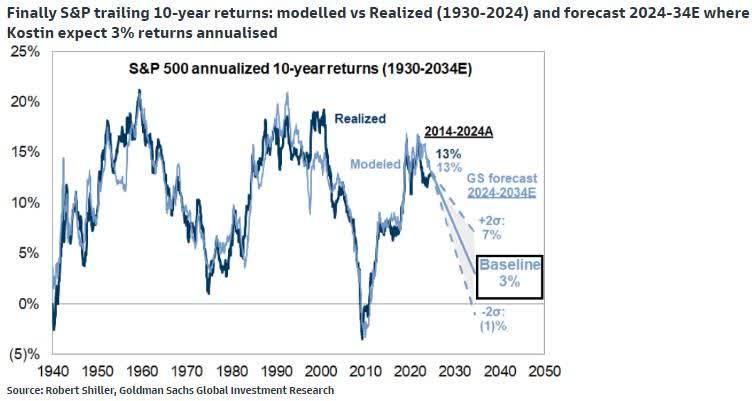
In a Goldman Sachs Research report published on October 19th, they projected a 3% annualized return for the S&P 500 over the next 10 years. While we would take the over in an environment with 2-3%+ inflation, we anticipate lower overall market returns than the past few years. In this context, we believe correlations between individual companies will decrease, allowing underlying fundamentals to drive performance rather than relying on broad market tailwinds. This shift presents an attractive opportunity for long/short equity stock pickers.
Portfolio Update
During the quarter, our net beta adjusted exposure generally fluctuated within the range of +/-10%, with an average of 2%. Gross exposure ranged between 155% and 200%, with an average of 178%. We continue to believe a net exposure in the range between 20-30% is optimal for our portfolio construction.
Our portfolio’s sector concentration was as follows: consumer (~32%), industrials (~31%), technology (~12%), other (~25%). 6 The majority of our “other” sector exposure (including sector hedges) represents our special situation healthcare investments. As discussed in our second quarter letter, we remain short consumer and long industrials. Our average dollar exposure for each sector was: consumer (-23%), industrials (+34%), technology (-7%), and other (+4%).
Performance Commentary
In July, we delivered strong performance, driven by outperformance from our long book while our short book remained nearly flat. Our gains were well-distributed, with seven positions contributing over 1% each (six longs and one short), and minimal detractors (the largest being -43bps).
In August, performance was impacted by a mix of macro factors and earnings-related pressures. The month saw heightened volatility, with markets reacting to an early index sell-off and a dramatic spike in the VIX, which surged from 16 to 60 before quickly fading back to 15 within two weeks. While the overall market rebounded, what went less noticed were the underlying market flows. Increased volatility, coupled with positive catalysts for several high-profile consumer shorts (e.g., Starbucks’ new CEO, Berkshire’s stake in Ulta Beauty, and strong Walmart earnings), likely drove significant degrossing activity. During degrossing, funds reduced exposure by selling longs and covering shorts, which led to the outperformance of lower-quality consumer stocks and high levels of short covering, likely amplified by the lighter summer trading volumes.
We continued to capture a positive spread between our long and short positions and believe the current environment remains favorable for our long/short stock-picking strategy.
Relative Performance of Long & Short Portfolio 7
|
Gross P&L Adj. For Hedges 8 |
Relative to S&P 500 |
Relative to Russell |
||
|
2024 YTD |
Longs |
17.6% |
11.7% |
8.3% |
|
Shorts |
(9.6%) |
(4.0%) |
(0.6%) |
|
|
Annualized Inception to Date |
Longs |
14.3% |
2.4% |
9.7% |
|
Shorts |
(3.3%) |
8.7% |
1.3% |
Third Quarter Gainers & Detractors
|
Gainers |
Detractors |
|
Sable Offshore (SOC) |
Event Short |
|
FTAI Aviation (FTAI) |
APi Group (APG) |
|
Arbutus (ABUS) |
Technology Short |
|
Roivant (ROIV) |
Consumer Short |
|
Consumer Short |
Consumer Short |
Top Gainers
Sable Offshore (SOC)
We initiated a long position in Sable Offshore ahead of a key catalyst. Sable is an exploration and production (E&P) company that acquired an offshore asset from Exxon, located off the coast of California. The asset had been shut down following a pipeline spill. In July, SOC received approval from the California State Fire Marshall to restart the pipeline, but it still required permits from Santa Barbara County to install new safety valves. While there was market uncertainty about whether Sable would secure these permits, our research indicated that a settlement was likely, as Santa Barbara lacked the legal grounds to block the installation and the resources to contest a lawsuit from Sable. We will likely provide further updates on Sable in our fourth quarter letter.
FTAI Aviation (FTAI)
FTAI continues to benefit from strong aerospace aftermarket tailwinds, with recent issues at Boeing presenting additional upside to both its short- and long-term business prospects.
As noted in our second quarter letter, FTAI’s Q2 results exceeded expectations, beating consensus estimates and prompting management to raise its guidance. Notably, FTAI increased its 2026 EBITDA target by 25%, from $1 billion to $1.25 billion. At the upper end of the newly raised Aerospace EBITDA guidance, FTAI has already achieved 46% of the $325-$350 million target, with this segment delivering approximately 30% quarter- over-quarter growth for the past four quarters.
While we believe strong financial performance will continue to support the stock price, we also see significant upside potential from narrowing the valuation gap between FTAI and its aerospace aftermarket peers. Despite the stock’s recent appreciation, we remain confident in FTAI’s outlook, with multiple catalysts expected to drive further growth through the remainder of the year.
Roivant (ROIV)
Roivant saw several positive developments during the quarter, with the most exciting being the launch of its new pipeline program, Mosliciguat. Roivant anticipates significant opportunities from future indications for this program, and we believe the acquisition of Mosliciguat has the potential to demonstrate the true value of Roivant’s platform and its disciplined capital allocation strategy. Additionally, positive updates from Immunovant and progress on 1402 further benefited Roivant’s share price.
Arbutus (ABUS)
While our primary interest in Arbutus is its exposure to the LNP litigation, much of this remains in Roivant’s hands. Although there were no major developments this quarter, positive commentary from Roivant’s management and favorable sell-side research have had a positive impact on Arbutus’s share price. Additionally, Arbutus discontinued its at- the-market offering during the quarter, signaling a shift in focus toward advancing its HepB assets internally.
Consumer Short
In our 2023 Third Quarter letter, we highlighted a consumer roll-up that we believed was over-earning and facing limited prospects for new growth, particularly due to its inability to pursue incremental M&A. Since then, both the company’s normalized earnings and valuation multiple have been significantly reduced. Ongoing challenges have resulted in a 50% decline in earnings compared to last year, prompting management to lower guidance. While we expect near-term difficulties to persist, we exited our position, as we believe management has now set a low bar for the remainder of the year, with the market already pricing in these more achievable expectations. We anticipate another actionable opportunity emerging over the next few quarters.
Top Detractors
Short
We held a short position in a low-quality business we viewed as a terminal zero. While we anticipated negative earnings results and future unfavorable catalysts, an unexpected low- probability positive catalyst materialized. Consequently, we exited the short position at a substantial loss.
APi Group (APG)
In August, APi announced its second-quarter earnings results, with slower-than-expected revenue growth negatively impacting the share price. While we expect near-term growth headwinds to continue putting pressure on the stock, we believe the company’s long-term success will be driven by disciplined capital allocation and ongoing margin expansion.
Technology Short
We are short a business that we expect will face slowing growth over the next few quarters. The company has significant customer concentration, and our analysis indicates it is experiencing negative growth outside of its largest customer. Additionally, the company has recently altered several of its reported growth metrics, which we believe should raise concerns among investors given the weakening underlying fundamentals. We see a more compelling short opportunity in the second half of the year, after the seasonally strong second quarter, as the company faces pressure to meet its full-year revenue growth guidance.
Consumer Short
This consumer business trades at one of the highest valuations within its peer group, and we believe slowing growth and potential operational missteps will lead to multiple compression. While our expectations of poor results were accurate, management attributed the underperformance to a one-time operational issue and emphasized improving business trends. Despite these challenges not being fully resolved, management continues to highlight positive momentum. We are closely monitoring the company’s fundamentals, as we believe there is potential for a significant decline in the share price, possibly up to 50%.
Consumer Short
We anticipated the company would underperform due to insider selling pressure from an expiring lockup and weak consumer trends in its core markets. With the stock trading at a significant premium to peers and a highly ambitious fiscal year guide, we expected near- term downside. Additionally, the stock received support from headlines about China’s stimulus efforts, a key market for the company. We continue to expect that insider selling, coupled with ongoing challenges in end markets, will lead to underperformance relative to the high growth expectations currently priced in by the market.
Comments on Portfolio Volatility
Our goal is to deliver above-market returns while maintaining a low correlation to equity markets. Approaching three years since launch, we believe we have achieved this, with our annualized returns outperforming the Russell 2000, despite being negatively correlated to the index.
This performance reflects our ability, since inception, to outperform the Russell 2000 while performing in-line with the S&P 500, all while maintaining a negative correlation to both indexes. We consider this a notable strength of our fund.
Our primary focus is on reducing market-driven volatility rather than the idiosyncratic volatility of individual stocks in our portfolio. For instance, a third-party analysis earlier this year indicated that approximately 80% of our portfolio’s risk has been idiosyncratic, meaning it is specific to individual companies rather than influenced by broader market, sector, or style factors. In contrast, many multi-manager funds target idiosyncratic volatility above 75%.
|
Tourlite Gross Returns |
Tourlite Net Returns |
S&P 500 |
Russell 2000 |
|
|
Annualized Return |
16.6% |
11.0% |
11.9% |
4.6% |
|
Correlation to S&P 500 |
-41% |
100% |
85% |
|
|
Correlation to Russell 2000 |
-31% |
85% |
100% |
|
Operational Update / Closing Thoughts
In January, we will be in Miami during the iConnections conference. If you are interested in connecting in person, please don’t hesitate to reach out.
The fund is currently open to new subscriptions. Accredited investors can contact us at ir@tourlitecapital.com with any questions or inquiries.
Sincerely,
Jeffrey G. Cherkin
|
1 Any net returns presented herein reflect the returns of the Fund assuming an investor “since inception”, with no subsequent capital contributions or withdrawals. These returns are not necessarily indicative of your net returns in the Fund, and you should follow-up with Tourlite if you have any questions about the returns presented herein 2 Bloomberg Total Return 3 Annualized Return from Fund inception in April 2022 4 Beta-adjusted exposures are calculated relative to the S&P 500. Exposure represents YTD average 5 Includes currency hedges and other trading costs. Borrow cost included in short return 6 Average of industry gross exposure over the period. Other sectors include healthcare and real estate 7 Performance of short portfolio is relative to the inverse of selected Index 8 Represents gross return on invested capital. Long and short P&L adjusted for respective contributions of hedges IMPORTANT NOTES This letter is being furnished by Tourlite Capital Management, LP (“ Tourlite”) on a confidential basis to recipient and does not constitute an offer, solicitation or recommendation to sell or an offer to buy any securities, investment products or investment advisory services. Such an offer or solicitation of an investment in Tourlite Fund, LP (the “ Fund”) may be made only by delivery of the Fund’s confidential offering documents that contain a description of the material terms relating to such investment, of which this letter is not a part. The information and opinions expressed herein are provided for informational purposes only, are as of the date indicated, are summary in nature, are not complete, are subject to change and should not be relied upon by any person in making an investment decision. An investment in the Fund is speculative due to a variety of risks and considerations as are detailed in the confidential offering documents of the Fund, and this letter is qualified in their entirety by the more complete information contained therein. This letter is strictly confidential, and the information contained herein or provided herewith may not be disclosed or distributed by the recipient to any other person (other than the recipient’s affiliates, partners, members, directors, officers, employees and advisors and other agents who have a legitimate need for such information in connection with evaluating the recipient’s investment). Your receipt and review of this letter constitutes your agreement to comply with these provisions. An investment in the Fund involves a significant degree of risk, and there can be no assurance that its investment objectives will be achieved or that its investments will be profitable. This letter contains various estimates, targets and projections that are based upon various assumptions made as of the date such estimates, targets or projections were developed. Actual realized returns on unrealized investments and proceeds will depend upon various factors including, but not limited to, future operating results, the value of the assets and market conditions at the time of any disposition, any related transaction, operational and other costs and the timing and manner of sale. While estimates, targets and projections provided herein are believed to be reasonable approximations based upon available information available to Tourlite as of the date of this letter, no guarantee or assurance can be provided as to their accuracy or that such estimates, targets or projections will be achieved or met. Unless otherwise noted, the performance results of the Fund included in this letter are presented on a net-of-fees basis and reflect the deduction of, among other things, underlying management and performance fees and expenses as well as brokerage and/or custodial fees and expenses. Performance results also include the reinvestment of dividends and other earnings. Certain of the performance information presented in this letter are unaudited estimates based upon the information available to Tourlite as of the date hereof, and are subject to subsequent revision as a result of the Fund’s audit. An investor’s actual performance and actual fees may differ from the performance information shown due to, among other factors, capital contributions, withdrawals and eligibility to participate in “new issues.” The value of investments can go down as well as up. Past performance is not necessarily an indication of future performance or profitability. References to Dow Jones, S&P 500, NASDAQ, Bloomberg and other indices herein are for informational and general comparative purposes only. There are significant differences between such indices and the investment program of the Fund. The Fund does not invest in all or necessarily any significant portion of the securities, industries or strategies represented by such indices. References to indices do not suggest that the Fund will, or is likely to, achieve returns, volatility or other results similar to such indices. Certain information set forth in this letter is based upon information obtained from various third parties believed by Tourlite to be reliable. Neither Tourlite nor any of its affiliates has independently verified any such information and they shall not have any liability associated with the inaccuracy or inadequacy thereof. This letter and the accompanying discussion include forward-looking statements. All statements that are not historical facts are forward-looking statements, including any statements that relate to future market conditions, results, operations, strategies or other future conditions or developments and any statements regarding objectives, opportunities, positioning or prospects. Forward-looking statements are necessarily based upon speculation, expectations, estimates and assumptions that are inherently unreliable and subject to significant business, economic and competitive uncertainties and contingencies. Forward-looking statements are not a promise or guaranty about future events. The information in this letter is not intended to provide, and should not be relied upon for, accounting, legal, or tax advice or investment recommendations. Each recipient should consult its own tax, legal, accounting, financial, or other advisors about the issues discussed herein. |
Editor’s Note: The summary bullets for this article were chosen by Seeking Alpha editors.


