THQ: Questionable Distribution Coverage (Rating Downgrade)

J Studios
Overview
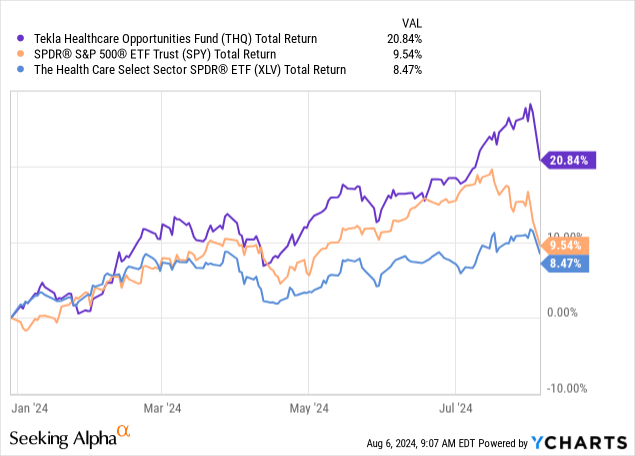
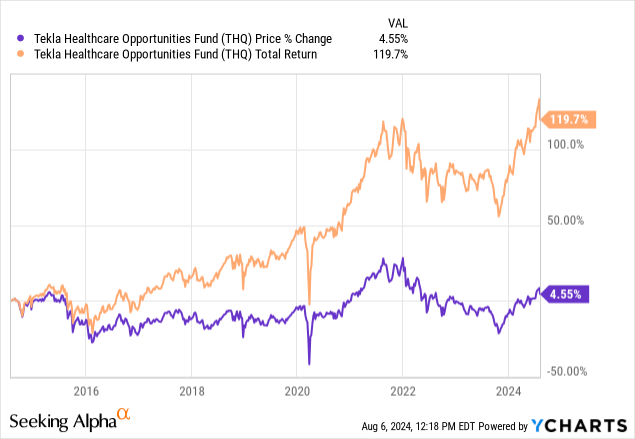
With interest rate cuts on the horizon, I believe that the healthcare sector may have a catalyst for growth. I previously covered abrdn Healthcare Opportunities Fund (NYSE:THQ) back in mid-April and since then, the total return has outpaced the S&P 500 (SPY). We can see that on a YTD basis, THQ has returned shareholder shareholders a return of 27% including the distributions. This outpaces the total return of 12.8% of SPY and I wanted to revisit this healthcare focused closed end fund to assess whether or not we can expect this outperformance to continue into the future. We can see that THQ has also outperformed the overall health care sector (XLV) in total return.
I believe that THQ is the perfect way to maintain a balanced exposure to the healthcare sector and capture a total return comprised of both income and capital appreciation. THQ operates as a closed end fund maintains a diverse exposure across the industry. The fund has a net expense ratio of about 1.47% and has a public inception dating back to 2014, which means that we now have a decade worth of performance to reference and analyze. One of the main appeals of this fund is that it sports a high yield of about 10% and issues its distributions out on a monthly basis. I do have some concerns on the current state of the distribution and worry that it may not be sustainable in the future.
In addition, the recent price run has made the fund a bit expensive at the moment, and I am downgrading my rating for now. I believe that when it comes to closed end funds like THQ, one of the most important aspects to your investment is the point of entry. THQ does trade at a very slight discount to its net asset value but based on historical trends, I believe it may be trading at the higher end of its range. However, let’s first start by reviewing the fund’s portfolio.
Portfolio Strategy
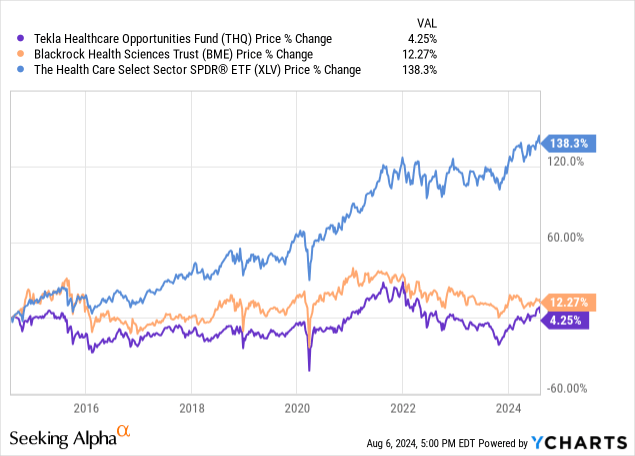
One of the unique aspects of THQ is that the fund implements an option writing strategy to generate higher income to fuel the distribution. The percentage of the underlying assets that are overwritten generally remain less than 20% of the total assets. While this can help with higher income generation to support the yield, it also has the downside of capping the price appreciation experienced. This is because the upside is limited to what the strike price of these options are set at. This is one of the culprits to why the price change of THQ over the last decade has traded around the same range while the overall health care sector (XLV) has appreciated by nearly 145% over the same time period.
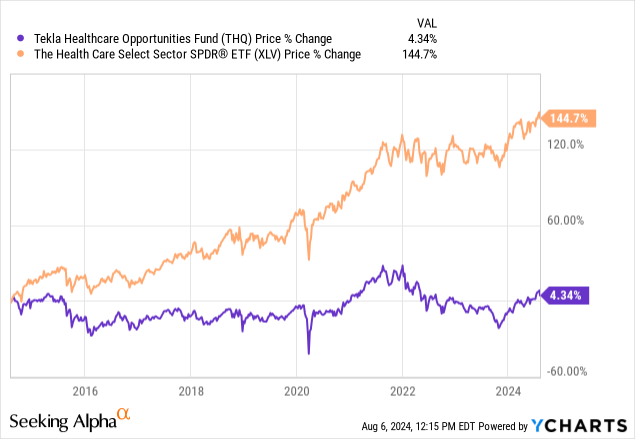
Therefore, THQ is best utilized for the investors that are looking to prioritize income over growth. Despite the price remaining around the same range, the total return has exceeded 100% since inception because of the continued high distribution rate. An attractive aspect of THQ is that you are obtaining this high yield by maintaining exposure to a diverse set of holdings within the healthcare sector.
According to the most recent fact sheet, the leading sub sector of healthcare is pharmaceuticals, making up 29.1% of the fund’s net assets. This is followed by health care equipment and biotech, making up 21.1% and 16.9% respectively. This includes top holdings such as Eli Lilly (LLY), UnitedHealthcare (UNH), and Merck (MRK). The top holdings account for about 44.45% of the fund,
THQ Fact Sheet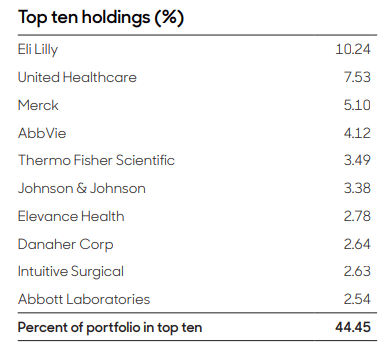
There have been some slight positions shifts from the last time I covered THQ and here are the ones that were most notable to me.
- Eli Lilly (LLY) is now the largest position at 10.24% of net assets. This is an increase from the prior weight of 8.2%.
- The weight in Johnson & Johnson (JNJ) was reduced down to 3.38%. JNJ used to be the second-largest holding within and had a weight of 8.7%.
- Pfizer (PFE) is no longer part of the top ten holdings. PFE used to account for 4.1% of the exposure, but no longer has a spot as a one of the largest positions.
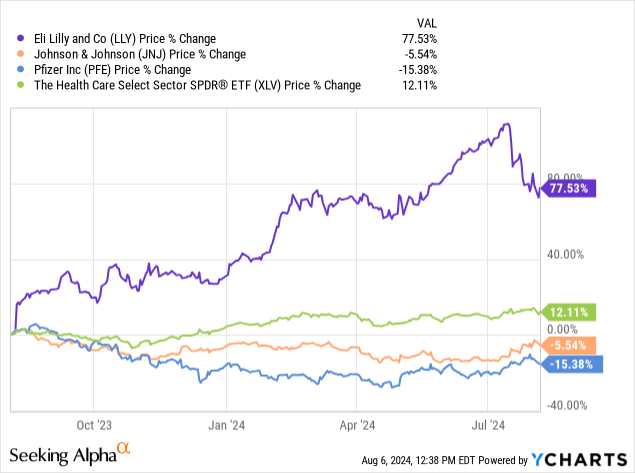
I do believe that these more noticeable changes could have been for the better. For instance, JNJ has suffered through a slew of ongoing litigations after another and the latest developments were around their talc related lawsuit. Similarly, Pfizer’s price has fallen off a cliff after the tail end of the covid pandemic. There are concerns about upcoming patent expiries on some of their legacy drugs and is the source for questions around how PFE will sustain their sources of revenue. So these were positive moves in my opinion as management reduced lower performing holdings while increasing higher performing ones. For instance, look at the price comparison of the mentioned holdings. We can see that LLY has absolutely crushed it over the last twelve months in comparison.
Distribution Coverage & Financials
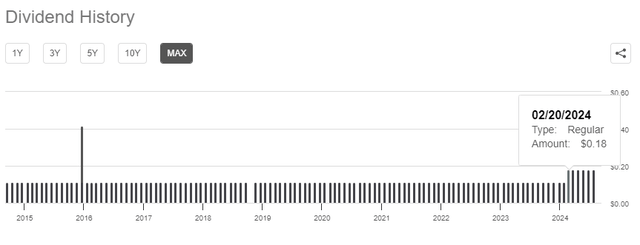
As of the latest declared monthly distribution of $0.18 per share, the current dividend yield sits at about 10%. Throughout the fund’s history, the distribution has remained pretty consistent and has never been cut. The distribution was raised back in February of 2024 to its current level. This consistency is valuable because it offers income investors a sense of stability and reliability. This is especially true for the retired investors that may depend on the income generated from their portfolio to supplement their lifestyle expenses.
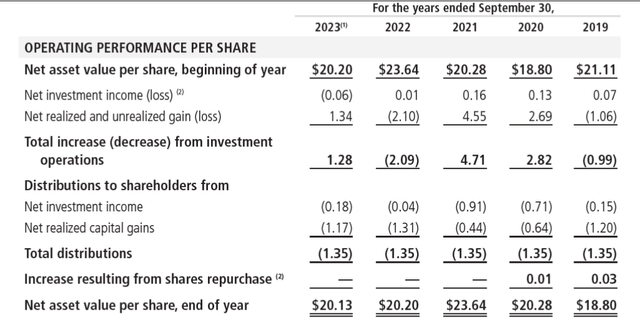
Since the distribution was recently increased, this brings the 5-year distribution CAGR (compound annual growth rate) up to 7.24%. However, the unfortunate news is that I don’t see the distribution getting raised again anytime soon. I’ve come to this conclusion by looking at the most recent annual report and seeing the exact breakdown of the distribution over the last five-year period. Starting in 2019, we can see that net investment income landed at $0.07 per share, while the fund realized losses of $1.06 per share. This certainly was not sufficient enough to cover the full distribution and as a result, the NAV likely shrunk and the distribution contained return of capital.
A similar story played out in 2022, where a combination of the fund’s net investment income and net realized gains were not enough to support the full amount of the distribution. My thoughts are that it seems like THQ has retained earnings from the stronger years, such as 2020 and 2021, and used the excess from those years to fund the distribution. While it’s a valid strategy, I would prefer to see a consistent performance in net investment income and net realized gains on an annual basis.
Looking at the most recent year of 2023, we can see that net investment income resulted in a loss of $0.06 per share while net realized gains amounted to $1.34 per share. While this was enough to cover the distribution by a slim margin, I can’t help but ask what motivated management to increase the distribution for 2024 if prior year’s performance was not very consistent. This makes me worry about whether or not the distribution rate can be sustained and whether or not THQ can retain enough of their potential earnings to help NAV grow at a meaningful pace. As we’ve seen over the last five-year period, the NAV growth has been lacking and hasn’t recovered to its peak of 2021 at a NAV of $23.64 per share.
I did manage to find the following table on the latest section 19a-notice. This indicates that ROC (return of capital) was used to fund the majority of the distribution on a YTD basis. Consistent reliance on return of capital can severely limit NAV growth and suppress the capital appreciation that the fund experiences since these distributions are pulled directly from the NAV.
While the use of return of capital typically has more favorable tax consequences, it is simultaneously stunting the fund’s future growth. Ideally, I would like to see less reliance on ROC as the healthcare sector starts to recover and regain positive momentum. Perhaps the fund will be able to better capitalize on the sector growth when interest rates are cut and market conditions improve.
Valuation
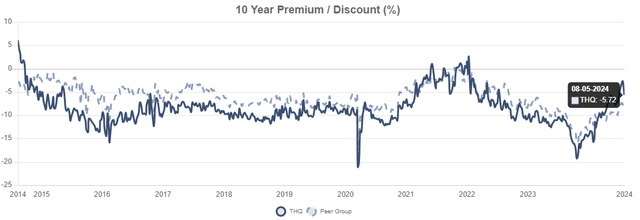
Since THQ operates as a closed end fund, the price can vary from the underlying net asset value of the fund. As a result, we can reference the discount history and see where THQ currently stands in relation. THQ trades at a discount to NAV of about 5.7%. Looking over the last decade of history, we can see that prior to 2020 the fund typically traded at a discount to NAV of about 10%. Even over the last three years, THQ has traded at an average discount to NAV of about 8.4%.
Therefore, the current discount can actually be considered a bit of a premium when compared against the fund’s norm. As a result, I am no longer accumulating shares of THQ and will be directing the distributions to other areas of my portfolio until value here looks more attractive. I believe that a big part of the value here with closed end funds comes from when the entry happens. I’d like to buy more shares when there’s more of a discount to NAV and with such uncertainty in the markets at the moment, I believe that there’s a strong possibility that THQ sees some downside action again.
There was recently an interview posted with Steven Cress where he discusses the general market reaction following interest rate cuts. Historical data has shown that the trend is a bit of a dip leading up to and following interest rate cuts as there still are levels of fear in the markets. Inflation has consistently decreased over the last three months and now sits at the 3% level, slowly approaching the Fed’s 2% target. At the same time, the unemployment rate has steadily increased over the last twelve months and now sits at the 4.3% level. The combination of these indicators may be enough to incentivize the Fed to begin cutting interest rates in September. While interest rate cuts would be good in the long run for a fund like THQ, I believe that the higher levels of uncertainty will ultimately provide a price decline that will serve as a better entry point.
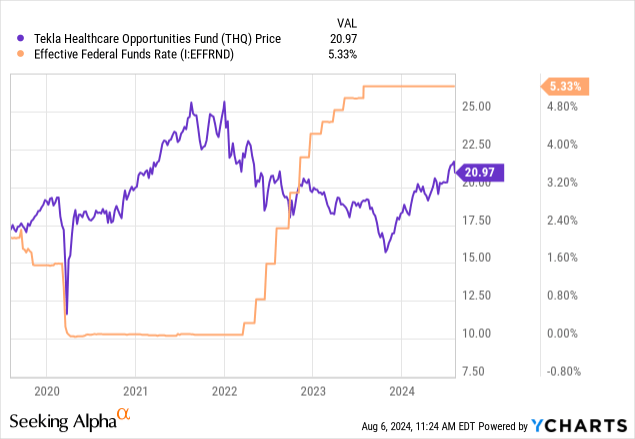
We can already see the inverse relationship that the federal funds rate and THQ have shared over the last few years. When rates were cut to near zero levels, THQ’s price rapidly appreciated due to a more favorable borrowing environment for healthcare companies. Near zero rates meant that it was more affordable to strategically hold debt as a way to finance research and development, fund acquisitions, and allocate capital towards other growth initiatives.
Conversely, when interest rates were aggressively hiked throughout 2022 and 2023, the price of THQ retracted as it was now less affordable to support these growth initiatives for companies in the healthcare sector. Therefore, it is likely that future interest rate cuts will provide relief to the sector and serve as a upward price catalyst. We can already see how the price fall reverse at the hopes and optimism surrounding these interest rate cuts.
Risk Profile
I fear that the current distribution rate can be unsustainable in the long run if the fund doesn’t improve performance by increasing the levels of net investment income received as well as improving the net realized gains. If the fund fails to improve performance, this can impact NAV. As we experience a deteriorating NAV, the price will also follow. While THQ does have a primary focus on income, it’s hard to justify it if it comes at the expense of capital preservation. Therefore, THQ does involve a level of risk related to underperformance that can lead to a distribution cut at some point.
A lower distribution can help boost NAV recovery and translate to more earnings retained to contribute to price upside. If the distribution is maintained and performance doesn’t improve, THQ’s price may move lower. There’s a chance that interest rate cuts do not happen and the underlying healthcare sector experiences slower growth going forward. If you are looking for growth exposure to the healthcare sector then THQ may not be the right choice for you. You may want to maintain exposure to the overall healthcare sector ETF (XLV) instead. Even the competitor fund, Blackrock Health Sciences Trust (BME) has been able to grow NAV more efficiently while incorporating a similar methodology behind its holdings and strategy.
Additionally, smaller portions of the distribution are funded by gains realized from buy and selling of holding as well as net investment income. These types of distributions are typically classified as ordinary dividends. Ordinary dividends are typically taxed at less favorable rates than the qualified dividends you would receive from more traditional dividend paying ETFs.
Takeaway
In conclusion, THQ is a solid healthcare related closed end fund that provides a well range of exposure to the sector. However, the recent price run up has made THQ a bit less attractive at the moment. Additionally, the continued use of return of capital is slowing the NAV growth of the fund. However, the use of return of capital is necessary to maintain the distribution at this point because of the underperformance in earnings from net investment income and realized gains. As a result, I am cautious on the sustainability of the distribution at the moment and will be observing how performance improves at the turn of interest rate cuts. Therefore, I am downgrading my rating to a hold.
