LONZ ETF: High Yield From Leveraged Loans (NYSEARCA:LONZ)

Torsten Asmus
I recently came across the PIMCO Senior Loan Active Exchange-Traded Fund (NYSEARCA:LONZ) while researching high-yielding investments.
The LONZ ETF is an actively managed fund focused on the leveraged loan asset class. While LONZ has outperformed a passive leveraged loan ETF, the outperformance appears to be a result of LONZ’s lower credit quality investments and higher leverage.
Looking forward, with unemployment rising and an economic slowdown on the horizon, investors may want to high-grade their portfolios away from the non-investment-grade leveraged loans held in LONZ’s portfolio. Investment-grade CLO ETFs may be viable alternatives, paying similar yields with better credit quality.
Fund Overview
The PIMCO Senior Loan Active Exchange-Traded Fund is a recently launched ETF from the fixed-income experts at PIMCO targeting the bank loan asset class.
Bank loans, also known as senior loans or leveraged loans, are floating-rate debt securities issued by companies with less than pristine credit histories. Historically, these loans were extended by banks, hence the term bank loans, although in recent years, many non-bank entities such as hedge funds have been extending leveraged loans to companies.
The LONZ ETF primarily invests in an actively managed portfolio of leveraged loans and US collateralized loan obligations (“CLOs”). CLOs are synthetic securities built from the securitization of baskets of leveraged loans.
The LONZ ETF has $541 million in assets (Figure 1) and charges an adjusted expense ratio of 0.60% (fee waivers until October 2025; reverts to 0.72% thereafter).
Figure 1 – LONZ overview (pimco.com)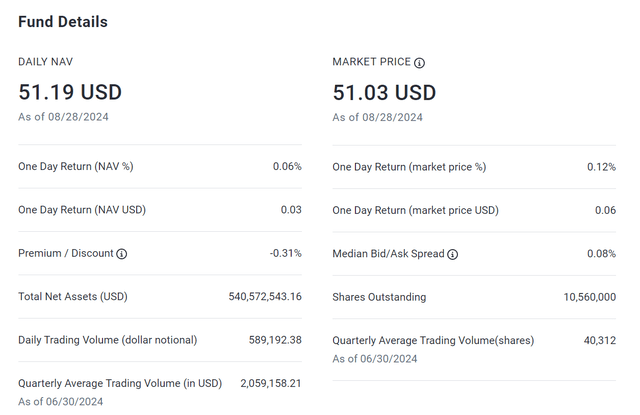
Portfolio Holdings
Looking through the fund’s disclosure, we see that the LONZ ETF has a 30-Day SEC yield of 6.5% while paying a distribution yield of 6.7% (Figure 2).
Figure 2 – LONZ yields and distribution (pimco.com)
The fund holds 328 securities with 86% of the portfolio allocated to bank loans, 3% allocated to bonds, and 26% allocated to “Other” securities which presumably means CLOs (Figure 3). The LONZ ETF also has a -15% allocation to other short-duration instruments, which means the fund has internal leverage.
Figure 3 – LONZ portfolio allocations (LONZ factsheet)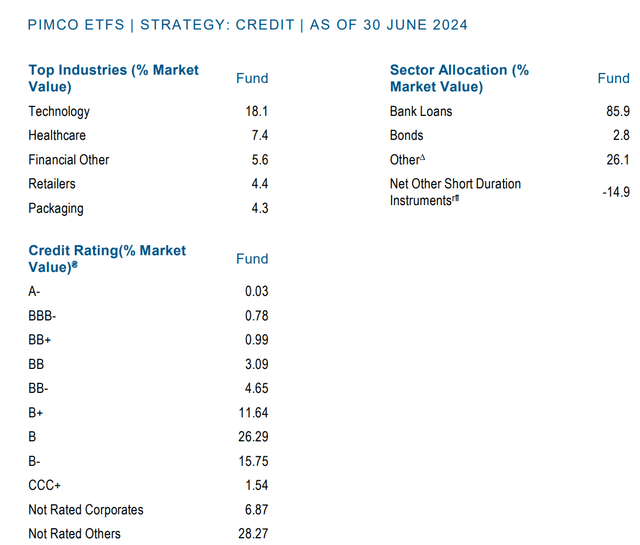
In terms of credit quality, the majority of LONZ’s portfolio is rated non-investment grade (CCC- to BB-rated), with 8.7% allocated to BB-rated securities, 53.7% allocated to B-rated securities, 1.5% CCC-rated, and 35.1% unrated.
Performance
In terms of historical performance, the LONZ ETF has done well since its inception in June 2022, returning 13.0% in 2023 and 10.4% on a 1-year basis to July 31, 2023 (Figure 4). Since inception, the fund has delivered average annual returns of 8.7%.
Figure 4 – LONZ historical returns (morningstar.com)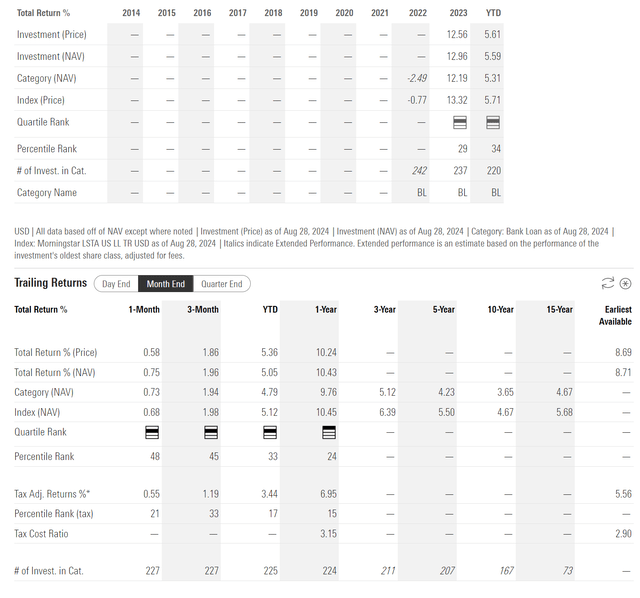
LONZ vs. BKLN
However, it is hard to look at LONZ’s performance in isolation, since a fund can deliver strong returns by taking excessive risks or leverage. To assess whether the fund manager has added ‘alpha’, I usually like to compare a given fund’s performance against passive ETFs that represent its asset class.
For the LONZ ETF, I believe a suitable passive ETF to compare to is the Invesco Senior Loan ETF (BKLN). The BKLN ETF tracks the investment results of the Morningstar LSTA US Leveraged Loan 100 Index (“Index”) and is the largest passive ETF targeting the leveraged loan asset class.
Figure 5 shows BKLN’s credit quality allocation. We can see that compared to the LONZ ETF, the BKLN ETF has higher credit quality, with 10.7% of its portfolio BBB-rated (compared to 0.8% for LONZ), 36.7% BB-rated (vs. 8.7%), 49.5% B-rated (vs. 53.7%), and only 3.2% rated CCC or unrated (vs. 36.6% for LONZ).
Figure 5 – BKLN portfolio allocation (BKLN factsheet)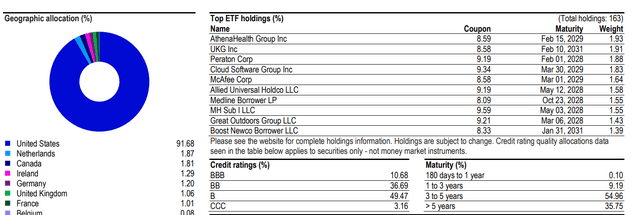
Comparing LONZ against BKLN, the LONZ has outperformed on a 1-year basis, returning 9.6% against BKLN’s 8.9% (Figure 6).
Figure 6 – LONZ vs. BKLN, 1-year returns (Seeking Alpha)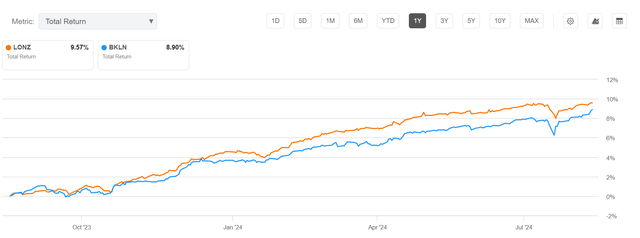
Since its inception, LONZ has returned 19.8% vs. 18.6% for BKLN (Figure 7).
Figure 7 – LONZ vs. BKLN, since inception returns (Seeking Alpha)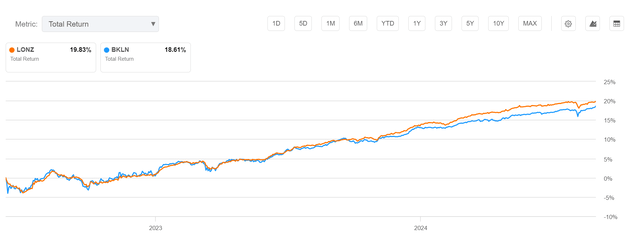
While LONZ has outperformed BKLN historically, we need to consider the fact that LONZ’s portfolio is considerably lower quality (lower credit ratings) and LONZ employs leverage. Adjusted for leverage, LONZ may not have outperformed.
For example, if we model a portfolio that is long 115% BKLN while short 15% the iShares 0-3 Month Treasury Bond ETF (SGOV) (approximating a 15% leveraged long position in BKLN), we can see that this model portfolio’s return since LONZ’s inception is virtually identical to that of the LONZ ETF (Figure).
Figure 8 – LONZ vs. leveraged long BKLN (Author created with Portfolio Visualizer)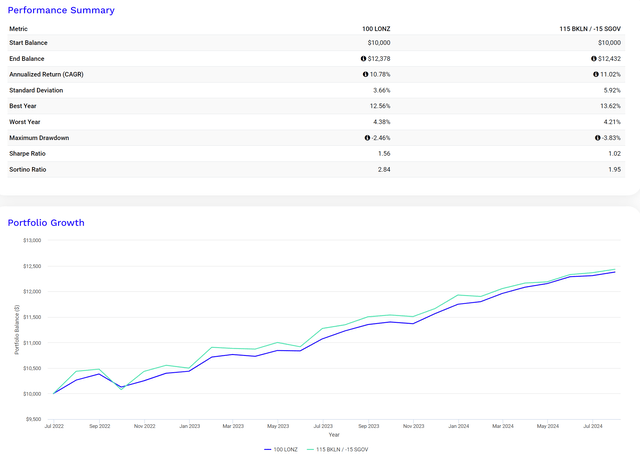
Consider CLOs Instead Of Bank Loans
Furthermore, considering the credit quality of LONZ’s portfolio, I recommend investors look at alternative floating-rate funds like the Janus Henderson AAA CLO ETF (JAAA) or the Janus Henderson B-BBB CLO ETF (JBBB).
JAAA holds a portfolio of floating-rate AAA-rated Collateralized Loan Obligations (“CLO”) while JBBB holds BB- to B-rated CLOs. To understand why CLOs may be better than leveraged loans, we first need to understand the CLO structure and securitization process.
As briefly mentioned above, CLOs are securities created from baskets of underlying leveraged loans. Through a securitization and tranching process, CLO managers create highly rated synthetic investment-grade securities (BBB- to AAA-rated) from non-investment-grade leveraged loans (Figure 9).
Figure 9 – CLO overview (JAAA product brief)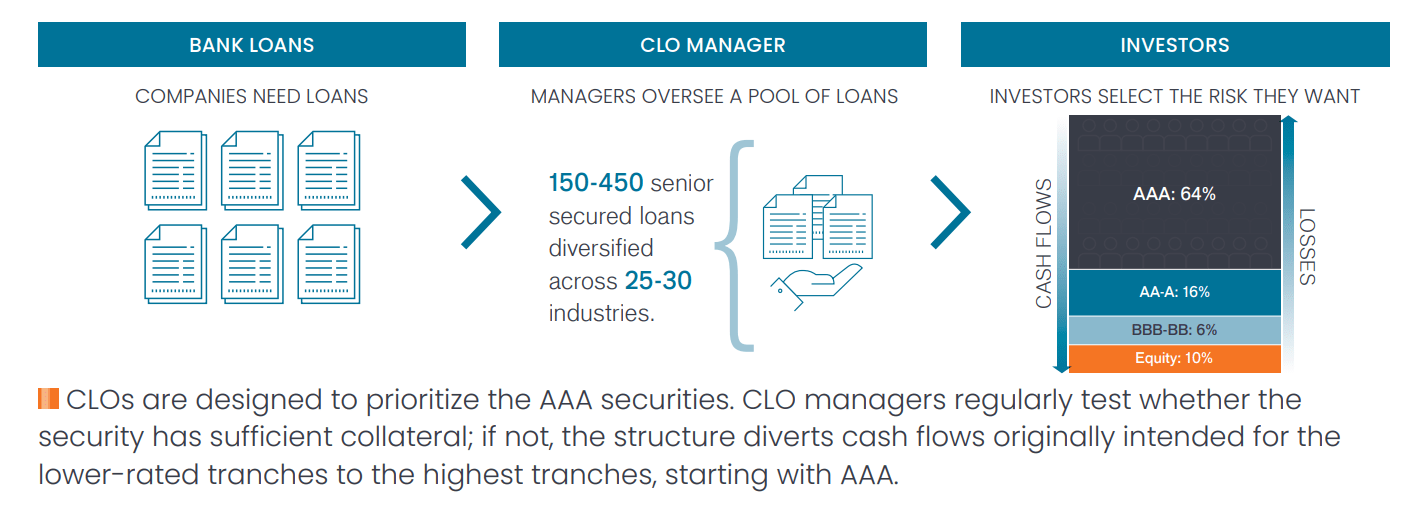
Investment-grade CLO debt tranches are protected from credit losses by structural enhancements like over-collateralization and interest diversion. Over-collateralization means that the CLO manager may pool together $120 million of loans to create $100 million of investment-grade debt securities plus $20 million of ‘equity’ securities. When credit defaults occur in this portfolio, the more senior debt tranches of the security (i.e., AAA) are protected from defaults by the equity and junior debt tranches (i.e., the ‘equity’ tranches take the first loss, followed by CCC, B, BB, etc.).
Interest diversion means senior debt tranches have priority on the cashflows collected from the pool of loans (i.e. AAA tranches are paid interest first, followed by AA, etc.).
Due to these structural enhancements, CLOs have historically experienced very few credit defaults, even through the 2008 Great Financial Crisis (Figure 10).
Figure 10 – CLO defaults by original credit rating (S&P Global)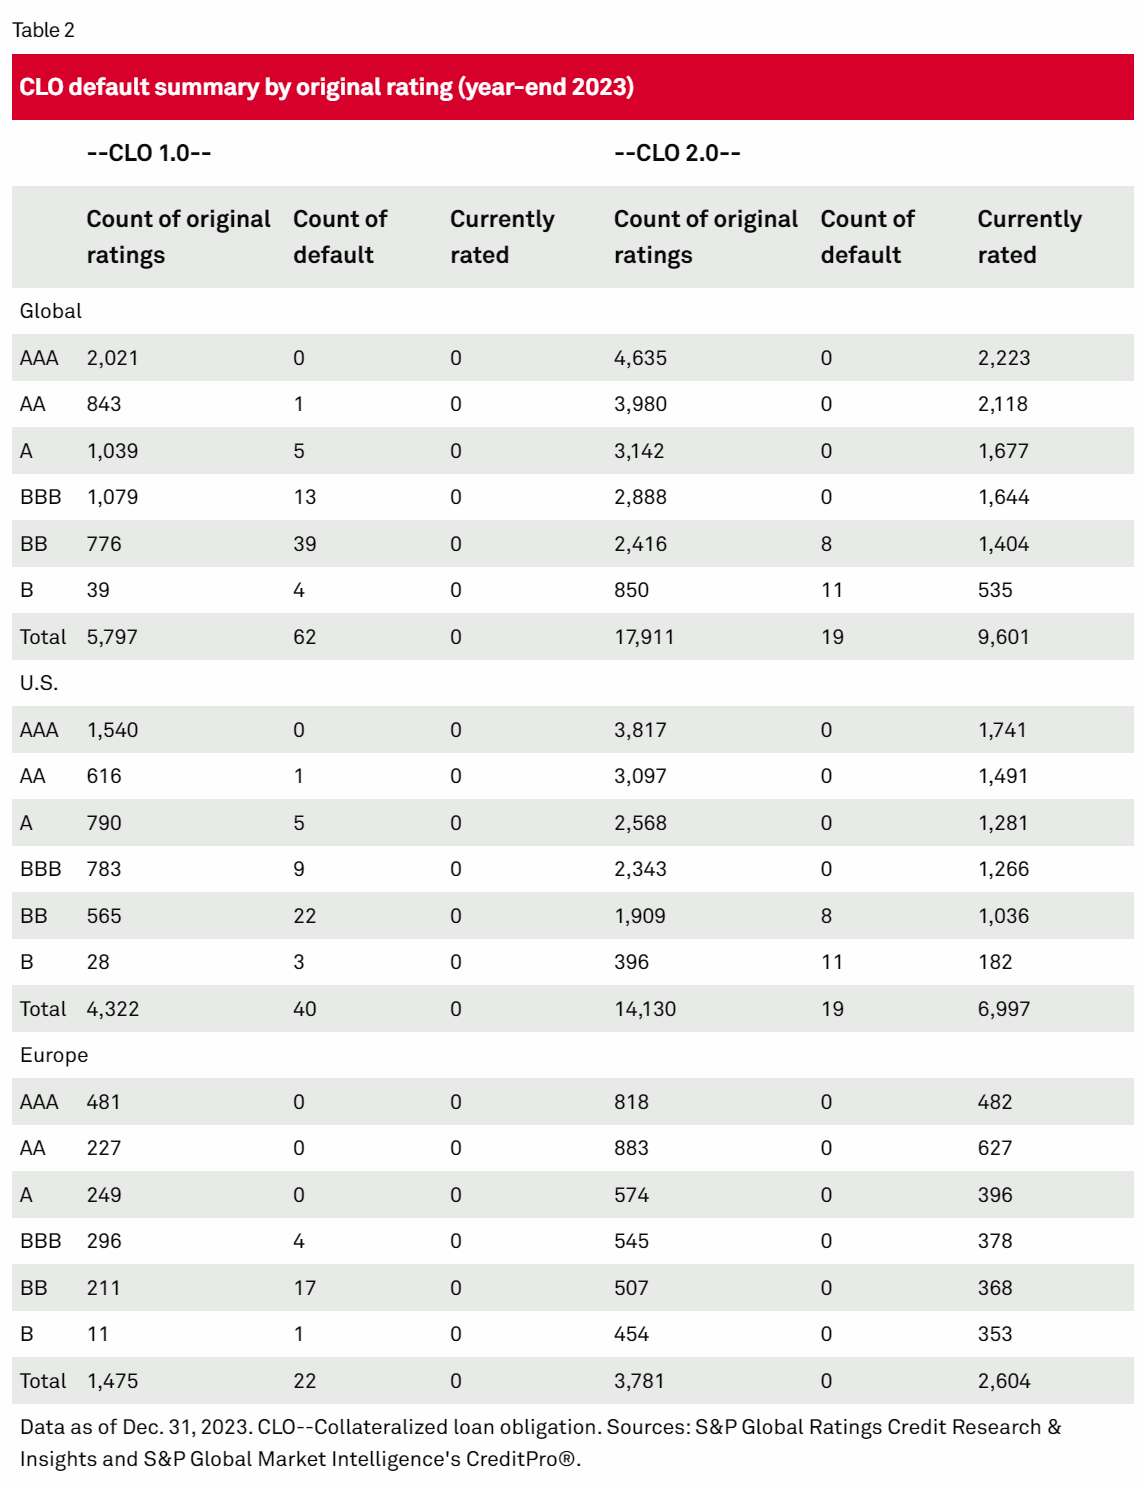
Comparing the LONZ ETF against BKLN, JAAA, and JBBB, we can see that the Janus Henderson CLO funds also charge materially lower expenses (Figure 11).
Figure 11 – LONZ vs. BKLN, JAAA, and JBBB fund structures (Seeking Alpha)
Furthermore, in terms of credit quality, the JAAA and JBBB ETFs hold significantly higher-quality portfolios, with 97.8% of JAAA’s portfolio AAA-rated while 97.7% of JBBB’s portfolio is BBB-rated or above (Figure 12)
Figure 12 – JAAA and JBBB portfolio credit quality allocations (janushenderson.com)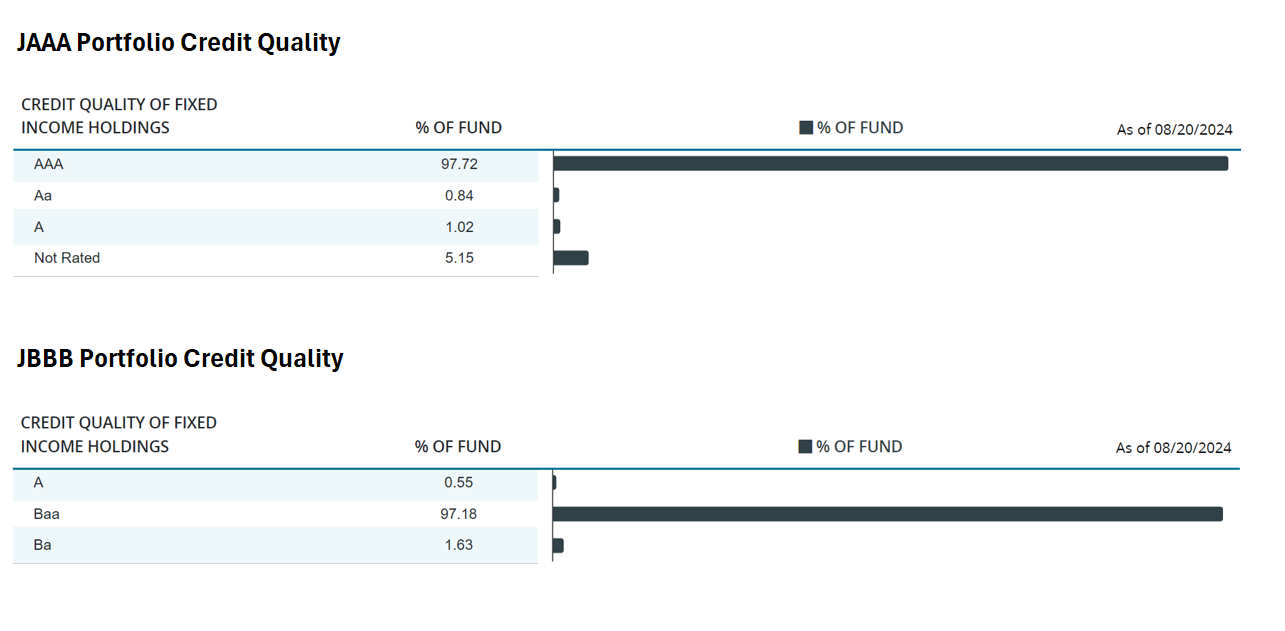
Even though credit quality is better, the JBBB ETF has historically outperformed the LONZ ETF, returning 21.0% since LONZ’s inception in June 2022 (Figure 13).
Figure 13 – LONZ vs. BKLN, JAAA, and JBBB, since inception returns (Seeking Alpha)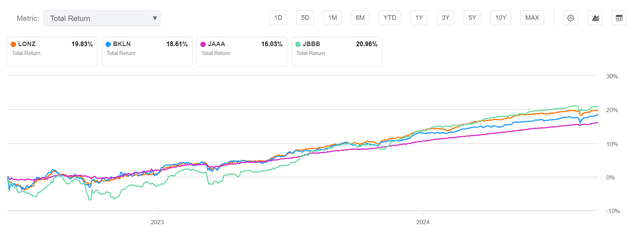
Beware A Slowing Economy
In recent months, I have penned several articles warning of a slowing economy. In my personal opinion, with unemployment rapidly rising from its cycle lows (Figure 14) and the Federal Reserve set to begin an easing cycle in the coming months, investors should take the opportunity to high-grade their portfolios.
Figure 14 – Unemployment has been rapidly rising in recent months (St. Louis Fed)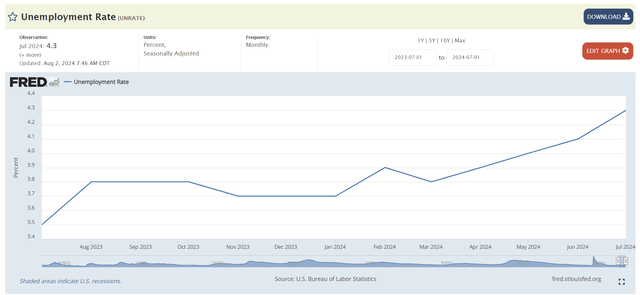
Rather than chase the trailing 7.6% distribution yield of the LONZ ETF, a better alternative may be to clip a 6.4% yield from JAAA, which holds mostly AAA-rated securities (Figure 15).
Figure 15 – LONZ vs. BKLN, JAAA, and JBBB ETF, distribution yields (Seeking Alpha)
While the LONZ ETF has certainly outperformed JAAA since June 2022, this is mostly on the back of tightening high-yield credit spreads, which have collapsed from near-6% in July 2022 to 3.2% currently (Figure 16).
Figure 16 – High-yield credit spreads have collapsed to cycle-lows (St. Louis Fed)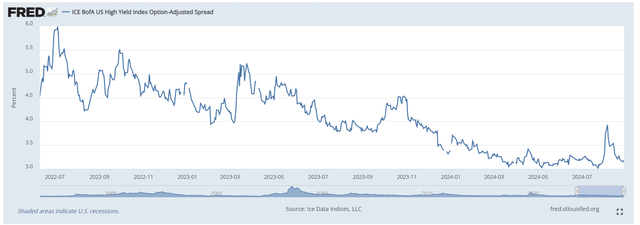
If the economy were to continue to weaken in the coming quarters, credit spreads would inevitably widen and negatively impact the non-investment grade leveraged loans within LONZ’s portfolio.
Conclusion
The LONZ ETF is an actively managed portfolio of leveraged loans and other floating-rate securities. Historically, the LONZ ETF has outperformed the passive BKLN ETF. However, I believe LONZ’s outperformance is mostly due to the modest internal leverage employed by the manager and the higher credit risk in its portfolio. Adjusted for leverage, LONZ’s performance is virtually identical to the passive BKLN ETF.
With a possible economic slowdown on the horizon, I recommend investors high-grade their portfolios. Instead of the LONZ ETF, investors may want to consider CLO ETFs like the JAAA or JBBB ETFs which have structural credit enhancements to protect investors. I rate LONZ a hold.


