Invesco Global Real Estate Fund Q3 2024 Commentary (AGREX)

cherdchai chawienghong/iStock via Getty Images
Standardized performance (%) as of September 30, 2024
|
Quarter |
YTD |
1 Year |
3 Years |
5 Years |
10 Years |
Since inception |
||
|
Class A (MUTF:AGREX) shares inception: 04/29/05 |
NAV |
14.99 |
9.66 |
24.94 |
-0.58 |
0.15 |
3.02 |
4.41 |
|
Max. Load 5.5% |
8.63 |
3.58 |
18.13 |
-2.44 |
-0.98 |
2.44 |
4.10 |
|
|
Class R6 shares inception: 09/24/12 |
NAV |
15.10 |
9.98 |
25.56 |
-0.12 |
0.60 |
3.50 |
4.27 |
|
Class Y shares inception: 10/03/08 |
NAV |
15.09 |
9.87 |
25.44 |
-0.32 |
0.41 |
3.27 |
4.89 |
|
Custom Global Real Estate Index |
16.07 |
11.77 |
28.86 |
0.39 |
1.20 |
3.94 |
– |
|
|
Total return ranking vs. Morningstar Global Real Estate category (Class A shares at NAV) |
– |
– |
84% (158 of 187) |
73% (130 of 179) |
85% (153 of 172) |
78% (96 of 118) |
– |
Calendar year total returns (%)
|
2014 |
2015 |
2016 |
2017 |
2018 |
2019 |
2020 |
2021 |
2022 |
2023 |
|
|
Class A shares at NAV |
14.15 |
-1.61 |
1.57 |
12.66 |
-6.16 |
22.47 |
-12.44 |
25.26 |
-25.23 |
8.60 |
|
Class R6 shares at NAV |
14.78 |
-0.96 |
2.20 |
13.04 |
-5.85 |
23.12 |
-12.06 |
25.77 |
-24.86 |
9.17 |
|
Class Y shares at NAV |
14.41 |
-1.36 |
1.82 |
13.02 |
-6.07 |
22.79 |
-12.21 |
25.50 |
-24.99 |
8.90 |
|
Custom Global Real Estate Index |
14.70 |
-1.19 |
3.75 |
13.99 |
-6.37 |
22.50 |
-9.95 |
24.22 |
-25.09 |
9.67 |
|
Expense ratios per the current prospectus: Class A: Net: 1.42%, Total: 1.42%; Class R6: Net: 0.95%, Total: 0.95%; Class Y: Net: 1.17%, Total: 1.17%. Performance quoted is past performance and cannot guarantee comparable future results; current performance may be lower or higher. Visit Country Splash for the most recent month-end performance. Performance figures reflect reinvested distributions and changes in net asset value (NAV). Investment return and principal value will vary so that you may have a gain or a loss when you sell shares. Returns less than one year are cumulative; all others are annualized. On March 12, 2007, the fund reorganized from a closed-end fund to an open-end fund. Class A share returns prior to that date are those of the closed-end fund’s Common shares and include the fees applicable to Common shares. Fund performance was positively affected by a temporary 2% fee on redemptions that was in effect from March 12, 2007, to March 12, 2008. Without income from this temporary fee, returns would have been lower. Index sources: Invesco, RIMES Technologies Corp. Had fees not been waived and/or expenses reimbursed in the past, returns would have been lower. Performance shown at NAV does not include the applicable front-end sales charge, which would have reduced the performance. Class Y and R6 shares have no sales charge; therefore performance is at NAV. Class Y shares are available only to certain investors. Class R6 shares are closed to most investors. Please see the prospectus for more details. For more information, including prospectus and factsheet, please visit Invesco.com/AGREX Not a Deposit Not FDIC Insured Not Guaranteed by the Bank May Lose Value Not Insured by any Federal Government Agency |
Manager perspective and outlook
The third quarter was marked by economic stimulus measures and central banks easing monetary policy, which apparently boosted investors’ risk appetites across the world. Global listed real estate had one of its best quarterly returns ever, both on an absolute basis and relative to general equities. The sector’s prospects improved on apparent expectations of lower debt costs amid a solid economic backdrop.
Hong Kong and China real estate led REIT performance as China’s government announced a raft of measures designed to stimulate its slowing economy. US REITs also delivered good performance, particularly in anticipation of the Fed interest rate cut. Japan had the weakest performance as a change of political leadership and loss of economic momentum appear to have reduced investor enthusiasm. Globally, higher leveraged and lower valued real estate companies led results.
We have observed that listed real estate has delivered strong returns relative to broad equities following central bank easing as investors seemingly shift their attention to interest rate sensitive sectors. Falling interest rates and modest economic growth should in our view lead to good opportunities in real estate as a new investment cycle begins. Listed real estate companies that have favorable cost of capital relative to their private real estate peers and robust operating platforms are most likely in our estimation to find attractive investment opportunities.
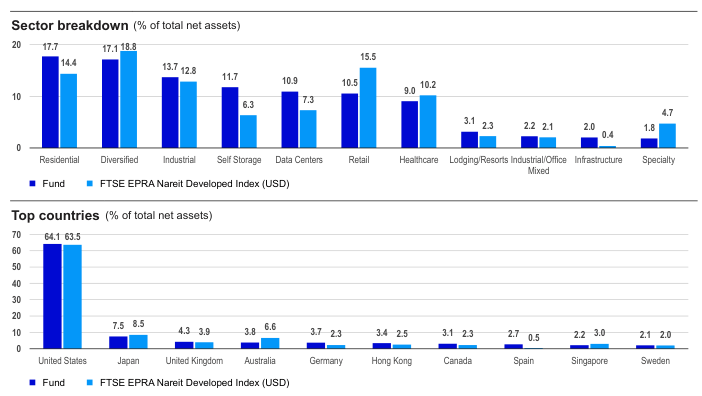
Portfolio positioning
Top issuers (% of total net assets)
|
Fund |
Index |
|
|
Equinix Inc (EQX) |
9.30 |
4.42 |
|
Realty Income Corp (O) |
5.91 |
2.90 |
|
Public Storage (PSA) |
5.68 |
3.02 |
|
Rexford Industrial Realty Inc (REXR) |
4.80 |
0.57 |
|
Invitation Homes Inc (INVH) |
4.45 |
1.13 |
|
Prologis Inc (PLD) |
4.29 |
6.12 |
|
Camden Property Trust (CPT) |
4.05 |
0.67 |
|
Healthpeak Properties Inc (DOC) |
3.20 |
0.84 |
|
LEG Immobilien SE (OTCPK:LEGIF) |
2.99 |
0.41 |
|
Alexandria Real Estate Equities Inc (ARE) |
2.92 |
1.08 |
|
As of 09/30/24. Holdings are subject to change and are not buy/sell recommendations. |
||
Overall, the fund is positioned for stable growth with more favorable long-term fundamentals and stronger tenant health. The fund’s positioning reflects a general view that the interest rate environment has become a tailwind for real estate, with some relative value opportunities emerging among the more stable property types. As such, we recently added exposure to sectors with long-term stable cash flows where valuations are discounted (health care, infrastructure). We have reduced exposure to REITs whose outperformance is historically more dependent on further improvement in economic growth (timber, lodging, billboards).
Geographically, the fund’s key overweights are in Europe (Germany, Spain and the UK). Overweight exposure in Europe is largely driven by our view that interest rate declines in 2024 will show that the region’s deeply discounted valuations are attractive relative to private market values. We shifted exposure to Japan in recent weeks to reflect our belief that a stable macro-economic environment and lower global bond yields will favor the stable value characteristics of JREITs.
Regarding property types, the fund is overweight in health care, industrial, self-storage and data centers. Underweight exposures include retail, office and diversified. Structural demand trends for data center REITs have remained intact as a solid earnings growth outlook is coupled with a tailwind from AI. Health care real estate in our view offers some attractive opportunities through well capitalized REITs exposed to improving fundamentals and accretive external growth, along with attractively valued, high yielding REITs offering stable
long-term income. The fund’s underweight in retail is the result of what we see as less interesting growth and valuation characteristics compared to other sectors.
Performance highlights
Top contributors (%)
|
Return |
Contrib. to return |
|
|
Equinix, Inc. (EQX) |
17.85 |
1.52 |
|
Public Storage (PSA) |
27.53 |
1.38 |
|
Realty Income Corporation (O) |
21.57 |
0.97 |
|
Rexford Industrial Realty, Inc. (REXR) |
13.73 |
0.83 |
|
LEG Immobilien SE (OTCPK:LEGIF) |
28.01 |
0.78 |
Top detractors (%)
|
Issuer |
Return |
Contrib. to return |
|
Host Hotels & Resorts, Inc. (HST) |
-0.89 |
-0.11 |
|
Invitation Homes, Inc. (INVH) |
-1.06 |
-0.05 |
|
Nomura Real Estate Master Fund, Inc. (OTCPK:NMMRF) |
-1.15 |
-0.01 |
|
Lineage, Inc. (LINE) |
-1.23 |
0.00 |
|
BXP Inc (BXP) |
0.00 |
0.00 |
Global listed real estate had a strong positive return for the quarter. The fund had a positive return as well but underperformed its benchmark, mainly due to stock selection.
Contributors to performance
The fund benefited from exposures in the Asia Pacific region. Notably, in Australia, the fund benefited from its underweight in Goodman Group, an industrial focused developer and fund manager that underperformed after strong performance in prior periods. The fund’s residential exposure in Australia also added to relative return. In Japan, stock selection among both JREITs and developers added to relative return.
Moving from an overweight to an underweight in Japan following its strong performance also benefited results. The fund’s positioning in Hong Kong added to relative return as Hong Kong retail REITs and developers benefited from China’s announcement of economic stimulus.
Detractors from performance
Stock selection among US REITs hampered relative return, although US returns were almost universally positive as appetite for REITs appeared to rise along with expectations for falling interest rates. Stock selection among US office-focused real estate was a detractor from relative return as life science REIT Alexandria Real Estate underperformed other more deeply discounted US office REITs. Additionally, a large position in single-family rental operator Invitation Homes lagged its residential- focused peer group after reporting that rental pricing power was moderating. An overweight in US lodging and stock selection among US industrial REITs also detracted from relative return.
Performance in Europe had a negative effect on relative return, mainly due to an overweight and stock selection in the UK. The country underperformed, hampered by companies with higher growth prospects that tended to lag as investors apparently rewarded value stocks. In particular, UK industrial REITs delivered less upside performance than we anticipated during the quarter.


