It Is Starting To Look Like An Intermediate-Term Sell-Off

TERADAT SANTIVIVUT
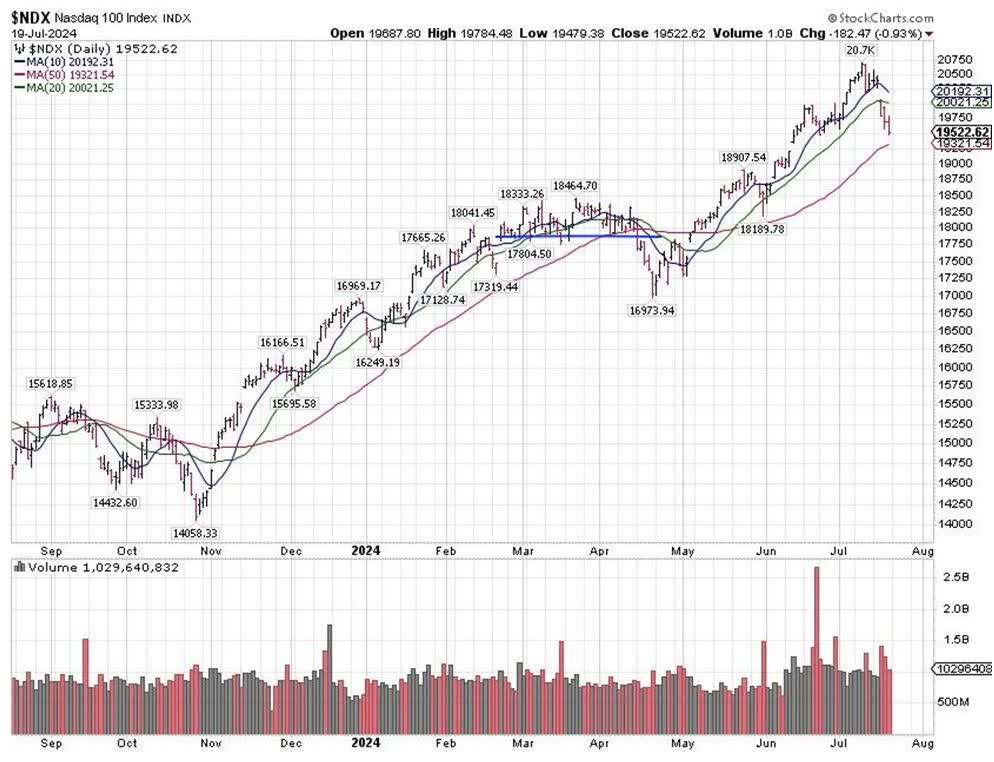
That was quick. The S&P 500 Index registered a fresh all-time high on Tuesday and proceeded to sell off by 179 points (-3%), high to low, by Friday. Meanwhile, the S&P 500 Volatility Index made a higher high compared to what it did after the Nvidia (NVDA) sell-off in May, and the NASDAQ 100 index has also exceeded the magnitude of the sell-off we saw post-Nvidia earnings. That type of quick selling over the last three days of last week invites some kind of rebound, even though it can always come from lower levels.
What bothers me in this scenario is the lack of any sideways trading before the market headed lower. In March, before we topped out for that last intermediate-term correction, there was at least six weeks’ worth of selling into strength before the market headed lower, which you can see best in the NASDAQ 100 Index chart (blue line below), as it was again suffering from a rotation into the value part of the market.

Graphs are for illustrative and discussion purposes only. Please read important disclosures at the end of this commentary.
Last week’s sell-off came like the flip of a switch. The rotation – where a computer algorithm buys the Russell 2000 Index and sells the NASDAQ 100 index – does not work very well, as the whole of the Russell 2000 Index is worth less (in market cap terms) than the value of a single company, Apple (AAPL), as I explained last week. The recent Russell 2000 out-performance is as large as we saw in the year 2000, when the tech bubble burst. We have not seen such a sharp divergence in 23 years.
Still, I do not believe this was (or is) a tech stock bubble akin to 2000. The NASDAQ 100 offers real sales and earnings, while back in the year 2000, some bubble stocks rose based on how many clicks a website got, even though the more clicks it got the more money those companies lost, as in many cases they could not monetize those clicks. In contrast, the present-day tech giants are spectacularly profitable.

Graphs are for illustrative and discussion purposes only. Please read important disclosures at the end of this commentary.
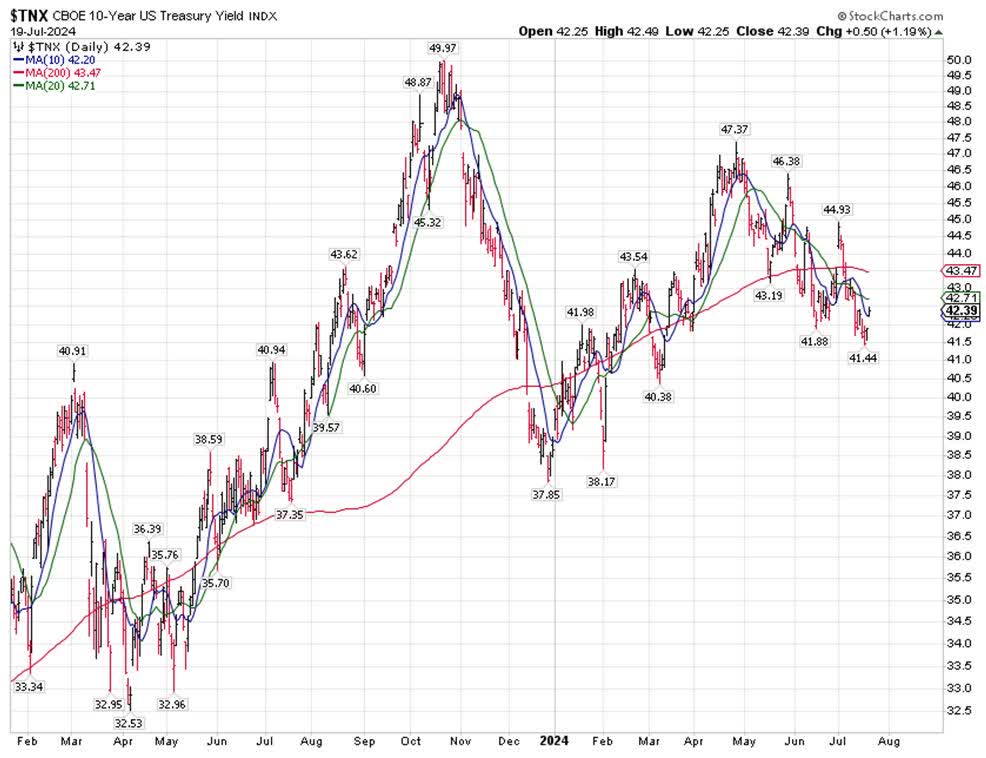
The present sell-off in growth equities comes at a time when the 10-year Treasury yield has clearly topped out (chart, above). In fact, one could say that this sell-off comes because it topped out in the sense that rate-cutting odds by the Fed are rising due to benign CPI readings, which is forcing the rotation in value equities. The 10-year Treasury is now 60 basis points below its April highs.
As I write (on Sunday), it would appear that we are ripe for some kind of a rebound in the broad market this week, and the most obvious level on the NASDAQ 100 Index is the 50-day moving average (the red line in the NASDAQ 100 index), which is only 200 points below last Friday’s close. We can never be too precise, so think of it as an area of support. A good estimate would be about 200-300 points below Friday’s close.
The way corrections go, the sharper the rally, the sharper the correction, so the selling we are seeing should not be all that surprising. Last year, the NASDAQ 100 topped out in the middle of July. It had two meaningful rebounds that never made new highs, and we saw the final low in late October. I have no idea if it will turn out to be the same way this year, but if it does, it would actually be fairly normal.
Navellier & Associates owns Nvidia Corp. (NVDA), and some accounts own Apple Inc. (AAPL), in managed accounts. Ivan Martchev does not own Nvidia Corp. (NVDA), or Apple Inc. (AAPL), personally.
All content above represents the opinion of Ivan Martchev of Navellier & Associates, Inc.
Disclaimer: Please click here for important disclosures located in the “About” section of the Navellier & Associates profile that accompany this article.
Disclosure: *Navellier may hold securities in one or more investment strategies offered to its clients.
Editor’s Note: The summary bullets for this article were chosen by Seeking Alpha editors.


