
9 Things Traders Need to Know

Corrections Since This Guide Was First Written
Updated August 2026. The DIA chart discussed in section nine is from early 2019. Several notable drawdowns have happened since, and they illustrate the same point the article makes — that a 10% pullback resolves in more ways than one:
- Q4 2018 — the S&P 500 fell close to 20% peak to trough into Christmas Eve, stopping just short of the bear market threshold, then recovered through 2019.
- February–March 2020 — the COVID selloff blew straight through correction territory into a roughly one-third decline in about five weeks, the fastest bear market on record.
- 2022 — an inflation and rate-driven decline that started as a correction in January and became a bear market that lasted most of the year.
- August–October 2023 — a textbook correction of roughly 10% that resolved into a new advance without ever becoming a bear market.
- Spring 2025 — a sharp tariff-driven selloff that pushed major indexes into correction territory before a rapid recovery.
Two of those five became bear markets and three did not. That ratio is the practical takeaway: the correction is knowable in real time, the outcome is not.
#1 – What is a Market Correction?
A trading correction is a common term used in the financial community to signify a market taking a breather but not one on life support. Think of a correction as a rain shower, while a bear market would be a hurricane.
Corrections are something that are discussed in terms of the broad market mostly. Stocks experience them as well, but when you hear the term correction floating around on CNBC, the broadcasters are not referring to a stock but the market at large.
The common rule of thumb is a correction is a pullback greater than 10% but less than 20% from the recent peak. Corrections can occur in both bull and bear markets.
Lastly, the market is able to stay above its 200 day moving average (in bull markets). This average is looked at by even fundamental traders as a clear line in the sand for who is in control of the trading activity.
However, when investors are discussing corrections it is often in the context of a pullback during a strong bull market. This will be the lens we discuss this topic within the article.
#2 – When is a Market Correction Over?
This is the holy grail of trading if you can figure this out. To answer the question, no one really knows. The true definition that everyone can agree on is when the market is able to exceed its prior high before the start of the correction.
Let me ask you, does this really help you as a trader? Probably not, since you are likely asking this question so you can time the market bottom in hopes of making a solid return as the market regains its way.
There are a few things you can look for that can further illuminate if the correction is on its last leg:
Fundamentals
- Companies are starting to report better than expected earnings and their current levels are below fair value
- Earnings season has passed and market volatility is starting to dry up
- The market is through typical seasonally weak periods such as May thru October
Technicals
- Volume is drying up as the market continues with the correction
- The leaders in the market are starting to trade sideways or higher
- The market is able to hold it’s 200-day moving average
#3 – What Sectors are Best Protected During a Market Correction

Gold Market
This one is a little easier to answer. When there are bear corrections, you will see a flight to what are considered safe havens for investors. These include gold, blue chips, and dividend-paying stocks.
Now, this doesn’t mean you are completely shielded from any pending doom and gloom, but it does mean these staples will keep you whole during the downturns.
#4 – What Sectors are Most Vulnerable During a Market Correction?
This is a moving target and depends on the reason for the correction and the stocks closely associated with this root cause. The one common theme you will see is weak stocks will get weaker during a correction not stronger.
Remember, cheap stocks can become cheaper.
To figure out the stocks or sectors most impacted, take a macro to micro-filtering approach.
You do this by comparing five or more major indexes. For example, take a look at the Dow Jones, S&P 500, Biotech Index, etc.
This will give you some indication of which sectors are over or underperforming relative to one another.
Once you have identified the sector impacted the most, then drill down into the individual securities that make up that sector. This will give you a list of stocks
#5 – How are Day Traders Impacted During a Market Correction?
There is little impact on day traders during market corrections. If anything, the market is actually providing greater trade opportunities. Remember for day traders it’s all about volatility at the end of the day.
Therefore, day traders should look for short opportunities during these periods of market weakness (again, assuming the correction is a slight bear pullback).
If you are a day trader that prefers to go long you will likely need to focus on the following instruments:
- ETFs that are the inverse of the index
- Gold and other precious metal related stocks
- Stocks in the news (their volatility is often enough to push thru market weakness)
#6 – Should Long-term Investors Continue to Invest During a Correction?
The definition of long-term investing is that you don’t need the money right now. Meaning you are socking money away for your future to ensure the financial well-being of you and your loved ones.
So, if the market is having a pullback, what do you think you should be doing? That’s right, buying.
Reason being, you are going to be able to average in at a lower dollar cost average when adding to your portfolio. This is just a no-brainer as the market on average appreciates better than any other asset.
#7 – How Long Do Market Corrections Last?
Market corrections are generally quick. These corrections can last a few weeks to a few months. If you see a market correction that is lasting a year or more, this is likely a new market trend setting in. This may not be the start of switching from a bear to bull market, but rather a trending market to a sideways pattern.
I was able to find an article on marketwatch that discussed a research effort from the Schwab Center for Financial Research that has cited over 22 market corrections since 1974. Of these corrections, only four resulted in a bear market, 1980, 1087, 2000 and 2007.
#8 – What’s the Difference Between a Market Correction and a Crash?
Check out this image from The Bubble Bubble.
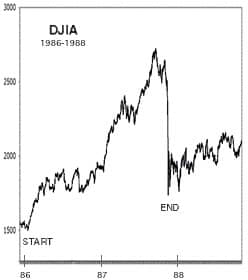
1987 Market Crash
Do you see how fast the market fell and how large of a percentage drop? Can you see the difference? Can you feel the pain?
If not, the first way you know the difference is in your bank account. With a market correction, you are going to see a slight dip in your statement over weeks or months. When there is a crash, you are likely checking your account statement every couple of hours and are having thoughts of putting all of your money in cash.
In terms of market fundamentals, a crash occurs when the market sells off greater than 20% and does so in a hurry. Are you familiar with the crash of 87 or the selloff during the mortgage crisis?
#9 – What are Some Examples of Market Corrections from Recent Years
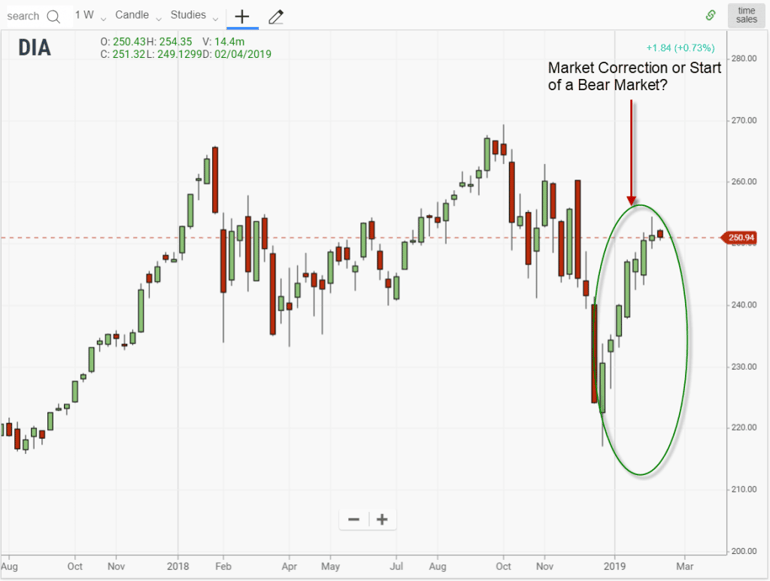
Market Correction or Bear Market
Do you see how hard this is in terms of locating a correction and then also determining whether it’s really a correction or the start of a bear market?
This is the chart of the DIA from early 2019. You can see how the market is starting to have lower tops and the last selloff was steeper. But is this the beginning of something sinister?
What do you think?
How Can Tradingsim Help?
Corrections occur quite often and are a natural part of market behavior. Don’t worry about trying to time some big sell-off as you saw earlier in this article, only 4 of 22 corrections resulted in bear markets.
So, if you are thinking of going over the top bearish, please think again.
You can practice trading market corrections in Tradingsim to work on identifying markers which will help you time and trade this setup. Remember, it’s not just about the market. You can also work on perfecting your ability to trade corrections in individual stocks. These corrections can occur on both a daily and intraday timeframes.
Good Luck,
Al
Frequently Asked Questions
What counts as a stock market correction?
The common rule of thumb is a decline of more than 10% but less than 20% from a recent peak. Once the drawdown passes 20% and persists, most market participants start describing it as a bear market instead.
How long do market corrections usually last?
Historically corrections have tended to resolve in a matter of weeks to a few months, which is far shorter than the typical bear market. The wide range matters more than the average: some resolve in days, others grind for a quarter.
Do market corrections always turn into bear markets?
No, and that is the central point of this guide. Most corrections stop short of bear market territory, which is why positioning for a crash every time the market drops 10% is an expensive habit.
Which sectors hold up best during a correction?
Defensive sectors such as consumer staples, utilities and healthcare have historically held up better than high-multiple growth names, because their earnings are less sensitive to the economic cycle.
How should a day trader handle a market correction?
Ranges widen and gaps get larger, so the practical adjustment is smaller size and wider stops rather than a different strategy. Trading a correction in a simulator first is the cheapest way to see how your setup behaves in that volatility.


