Keltner Channels vs Bollinger Bands [Updated April 2026]

I am a self-proclaimed ATR fanatic, yet I have not explored Keltner Channels. The Keltner Channel is a lagging on-chart indicator that uses a combination of exponential moving averages and the Average True Range (ATR) as inputs. Unlike Bollinger Bands, which uses standard deviations to calculate the width of the channel, Keltner Channels uses the exponential moving average and a multiplier on the ATR to determine the upper and lower bands.
I’m not as scientific as my other trader brethren are, so I’m not going to get into the details of the Keltner Channel formula, but rather will show you the inputs of the Keltner Channel.
The Keltner Channel indicator uses two inputs to configure the indicator. The first is the length of the exponential moving average and the second is the multiplier you would like to factor in with the ATR.
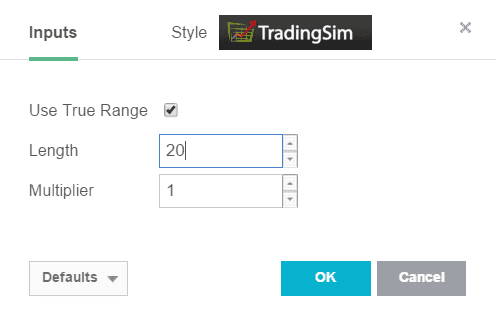
Keltner Channel Inputs
A good rule of thumb is the longer the length of the exponential moving average, the greater the lag on the indicator. Lastly, the higher the multiplier, the greater the width of the Keltner Channel.
You should remember to consider these two points when defining your Keltner Channel trading strategy.
If you want more of an understanding around the actual formula for the Keltner Channels, please visit this Wikipedia article.
Now, I could go on and on about how Linda Raschke tweaked Mr. Chester Keltner’s formula and yet the indicator is still called Keltner Channels, but I would rather dive into the charts of comparing the Bollinger Bands and Keltner Channels.
Again, if you are looking for more technical articles on the two indicators, there are tons of posts on the web. I figured I would just stick to the comparison and leave the number-crunching up to the mathematicians.
With that said, let’s dive into our first working example. Just to be clear, we are using the default settings for both the Bollinger Bands and Keltner Channels found in most trading platforms, which is 20 periods.
Example #1 – Riding the Trend
In the below chart example, we are reviewing a 5-minute chart of Ford with the default Keltner Channel settings of 20, 1 and the default settings for the Bollinger Bands.
You will notice on first glance at the chart that the channel is much tighter on the Keltner Channel.
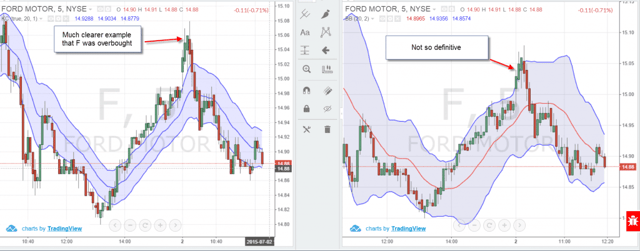
Keltner Channel vs Bollinger Bands – Example 1
In this particular example, it was much clearer to me using the Keltner Channel that Ford was done once it hit its peak. If you zoom in on the example, you can see that there were two green bars and one red bar that were completely outside of the envelopes. Once the second candle closed below the low of the preceding red candlestick and inside of the envelopes, Ford was done.
Now, if you look at the exact same chart, but with the Bollinger Bands, the action was neatly inside of the envelopes, so as a trader you have a tougher time identifying when a stock is going to break down.
If you are day trading with the Keltner Channel, having the ability to quickly notice when a trend can be changing is huge.
Therefore, in the example of riding the trend and knowing exactly when to get off the bus, I’m going to say Keltner 1, Bollinger Bands 0.
Example #2 – Strongly Trending Stocks

Keltner Channel vs Bollinger Bands – Example 2
For those of you wondering what is the difference between this example and riding the trend, it really comes down to the impulsiveness of the move. As you can see in the above chart, the price action for the most part stayed completely outside of the Keltner Channel. In our first example, the price movement wasn’t as extreme.
Okay, back to the second example, JDST went on a run that we all would love to partake in on a regular basis. The question comes down to which indicator would have me in sooner and allow me to ride the impulsive move higher?
Without a doubt, the Keltner Channels made it very clear when JDST started breaking out. Once the move started, I would have to say that both the Bollinger Bands and Keltner Channels did a great job allowing the trend to develop.
Due to the early entry on the run up, I have to give round 2 to the Keltner Channels. Our score now stands at Keltner Channels 2, Bollinger Bands 0.
Just a side note, assuming you are day trading, then the major gap down the next day would not apply because you would have closed your position.
Example #3 – Late Day Breakout
The late day breakout is the bane of my existence. I spent 20 months chasing these late day bloomers before finally realizing this wasn’t my calling. In the below example, we will dig into whether the Keltner Channels or Bollinger Bands can better detect when a stock is beginning to trend late in the day.
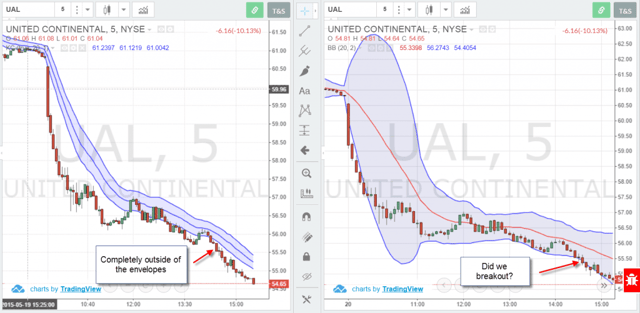
Keltner Channel vs Bollinger Band – Example 3
As you can see, UAL was trending sharply to the downside on the 5-minute chart. There was a swing low put in around 1:30 pm, and then the stock had a slight retracement before testing the daily low again at 2:25 pm.
This is where I would lock up, as I would be forced to make a decision. The volume of course would be light as we were in the early afternoon, yet there is a new low.
Well, the Keltner Channels provides us a nice head start on the move as the candlestick closes completely outside of the Keltner Channel. Therefore, while the volume and price action may not have been significant, you could clearly tell that the volatility was in play with a close outside of the channel.
Now as we look over at the Bollinger Band example, the stock was still nicely sitting inside of the bands, albeit riding the bands.
For this example, I have to go with the Keltner Channel, because I will always go with outside of the bands versus riding the bands in terms of strength of trend.
Our score now stands at Keltner Channels 3, Bollinger Bands 0.
Example #4 – Morning Reversal
The morning reversal is another powerful day trading pattern, as stocks will experience sharp snap back moves.
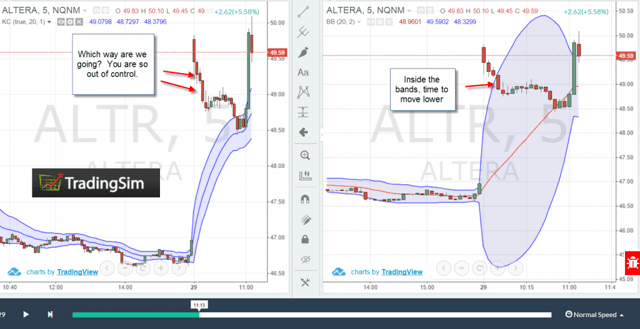
Keltner Channel vs Bollinger Band – Example 4
ALTR experienced a high volume gap up on May 29th. As I was reviewing the Keltner Channel, I realized the candlesticks were well beyond the upper channel. So, once ALTR started to give it up, how were you to know it’s time to short or where to exit your long position?
Conversely, as we look at the Bollinger Bands, once the stock comes inside of the bands, you know things are in trouble.
Therefore, in the snap back reversal, Bollinger Bands are more suitable as the indicator is based on standard deviations. The crazier the action, the wider the Bollinger Bands will expand, which will clearly display the breakdown if the stock starts to give it up.
Our score now stands at Keltner Channels 3, Bollinger Bands 1.
Example #5 – Choppy Stocks

Keltner Channel vs Bollinger Band – Example 5
Choppy markets are a reality of trading whether we like it or not. So, when it comes down to properly containing the price action, which indicator does a better job of filtering out the noise?
As you can see, the Keltner Channel is more sensitive to the price movements in tight channels, therefore buy and sell signals could be a bit exaggerated.
However, as the Bollinger Bands are calculated using standard deviations, the bands do a much better job of filtering out the noise within a range bound market.
Therefore, for choppy markets, the nod has to go to Bollinger Bands.
Our final score comes in with Keltner Channels 3, Bollinger Bands 2.
In Summary
Each of these price-lagging indicators do a great job for what they are designed to do.
As volatility is baked into the Keltner Channels, the indicator does an awesome job of providing insight into stocks when they are riding the trend, strongly trending higher or breaking out.
Whereas the standard deviation component of Bollinger Bands gives enough of a range between the upper and lower bands to better handle significant gaps that reverse sharply and range bound markets.
At this point, I’m assuming you are wondering which indicator is better and in the true form of a trader, I will say both.
As stated throughout this article, trying to say one indicator is better than another is relative. It truly comes down to the 5 scenarios you are attempting to trade and your trading goals.
To see how we can help improve your trading performance, try our TradingSim free software trial.
Much Success,
Al
Keltner Channels vs Bollinger Bands: Quick Answer (Updated April 2026)
Keltner Channels and Bollinger Bands are both volatility envelopes plotted around a moving average, but they measure volatility differently and behave very differently in real markets. Keltner Channels use the Average True Range (ATR) to set the band width — smoother, less reactive, and tuned for trend-following. Bollinger Bands use standard deviation — more reactive, faster to expand and contract, and better suited to mean-reversion in ranging markets.
| Feature | Keltner Channels | Bollinger Bands |
|---|---|---|
| Center line | 20-period EMA (typical) | 20-period SMA (typical) |
| Band width based on | ATR × multiplier (default 2) | Standard deviation × multiplier (default 2) |
| Reactivity | Slower; bands stay smoother | Faster; bands flex with each new bar |
| Best for | Trend continuation, breakout filters | Mean reversion, range trading, squeeze setups |
| Squeeze visibility | Less obvious — need to compare bands directly | Visible squeeze when bands narrow versus their own history |
| Outlier behavior | Not pulled wide by single spike bars | Pulled wide by single spike bars (because std dev reacts strongly to outliers) |
How to Read Each Indicator
Bollinger Bands tell you when price is statistically extended. A close outside the upper or lower band is a 2-standard-deviation event — statistically rare, but in trending markets the bands “ride” along price for extended periods. The classic Bollinger setups are:
- Squeeze: bands narrow to a multi-month minimum, signaling a coming volatility expansion. The breakout direction can be either way; trade the breakout, not the anticipation.
- Walking the band: in strong trends, price hugs the upper (or lower) band for many consecutive bars. Pullbacks to the center line offer trend-continuation entries.
- Mean reversion: in clear ranges, fade the upper band as resistance and the lower band as support, with confirmation from a reversal candle.
Keltner Channels tell you when price has moved an unusually large distance relative to recent ATR. They’re tuned for trend-following because the smoother bands don’t whip around outliers:
- Trend confirmation: a close above the upper Keltner band on a rising EMA confirms a new leg in the trend.
- Pullback entries: in an established uptrend, pullbacks to the EMA center line offer high-probability long entries with the upper band as the first target.
- Breakout filter: only take breakout trades that close beyond the Keltner band; intrabar tags don’t count.
The Squeeze Strategy: Combining Both
The most popular use case for these two indicators together is the squeeze — a setup originally popularized by John Carter. Plot both on the same chart with default settings:
- Trigger: Bollinger Bands move inside the Keltner Channels. Because std-dev compression has caught up with ATR, volatility is at a multi-week low and a strong move is statistically likely.
- Direction confirmation: wait for momentum to cross zero on a separate momentum oscillator (MACD histogram, TTM Squeeze, or simply the slope of the EMA). Take long if momentum is positive, short if negative.
- Entry: on the close of the first bar after the squeeze releases (Bollinger Bands move back outside the Keltner Channels).
- Stop: the opposite Keltner band.
- Target: 1.5× risk first scale-out; trail the rest behind the EMA center line.
When to Use Which (and When Both Lie)
Indicator selection should match market regime:
- Trending market with clear higher highs and higher lows: Keltner Channels for entries (pullbacks to the EMA), Bollinger Bands as a filter (price walking the upper band confirms the trend).
- Range-bound market: Bollinger Bands for fades (upper as resistance, lower as support). Keltner is less useful here.
- Pre-news, pre-earnings, or low-volume drift: both indicators lie. Volatility envelopes shrink around drift and produce false squeeze signals just before scheduled volatility releases. Use a calendar filter and avoid entries the session before earnings or major economic releases.
The Three Failure Modes That Trap New Traders
- Trading band touches as automatic reversals. In trending markets, “touch the upper band” means “buyers are in control,” not “time to short.” Use the slope of the center line as your trend filter before any mean-reversion trade.
- Ignoring the squeeze direction. Squeezes are direction-agnostic until they release. Don’t pre-position; wait for the first close outside the bands and trade with momentum.
- Default settings on every market. The 20-period, 2-deviation default works well on liquid US equities and the e-mini S&P, but illiquid stocks and slow-moving futures may need a longer lookback or wider multiplier. Test before you trust.
Practice Both Indicators in the TradingSim Simulator
Volatility envelopes only become useful when you’ve watched price react to them across hundreds of bars. Use the TradingSim simulator to train your eye:
- Sessions 1–3: Plot Bollinger Bands only on liquid stocks and the e-mini S&P. Mark every band-walk and every squeeze. Goal: pattern-recognition speed.
- Sessions 4–6: Add Keltner Channels. Compare how often Bollinger fires a fake “extreme” signal that Keltner correctly classifies as a routine trend extension.
- Sessions 7–9: Drill the TTM-style squeeze entry: BB inside KC, momentum cross, breakout entry, opposite-band stop. Track win rate and average winner vs loser.
- Session 10+: Run the same squeeze drill on micro futures (MES, MNQ) on the futures simulator before risking live margin.
FAQ
What is the main difference between Keltner Channels and Bollinger Bands?
Keltner Channels measure volatility with ATR (Average True Range), which produces smoother bands that don’t react to single-bar outliers. Bollinger Bands measure volatility with standard deviation, which makes them more reactive and quicker to flex on each new bar. Keltner is better for trend-following; Bollinger is better for range and mean reversion.
What is a squeeze?
A squeeze occurs when Bollinger Bands move inside the Keltner Channels — volatility has compressed enough that the standard-deviation envelope is narrower than the ATR envelope. Squeezes signal that a strong directional move is statistically likely, but they don’t tell you direction; momentum confirmation is required.
Should I use the 20 EMA or 20 SMA as the center line?
Keltner Channels traditionally use the 20-period EMA; Bollinger Bands traditionally use the 20-period SMA. Stick with these defaults unless you have a specific reason to change them. The default settings are what most traders watch, and that consensus matters.
Can I use just one of them instead of both?
Yes. Many trend-followers use only Keltner Channels with a 20 EMA and 2× ATR multiplier — cleaner trend signals and fewer false alarms. Many mean-reversion traders use only Bollinger Bands. Combine them when you specifically want squeeze setups.
Do these indicators work on futures?
Yes, both work well on liquid futures (ES, NQ, CL, GC) and on micro contracts (MES, MNQ). The default settings are a reasonable starting point. Backtest before you go live; volatility characteristics differ enough across futures markets that small tuning may help.


